RRT Logo
  • HOME
  • ABOUT US
  • PROPERTIES FOR SALE
  • SELL YOUR HOME
  • SEARCH BY LOCATION
    • Cape Coral
    • Fort Myers
    • Fort Myers Beach
    • North Fort Myers
    • Lehigh Acres
    • Sanibel
    • Alva
    • Labelle
    • Estero
    • Matlacha
  • (239) 242-2000
CONTACT US
RRT Logo
RRT Logo
  • HOME
  • ABOUT US
  • PROPERTIES FOR SALE
  • SELL YOUR HOME
  • SEARCH BY LOCATION
    • Cape Coral
    • Fort Myers
    • Fort Myers Beach
    • North Fort Myers
    • Lehigh Acres
    • Sanibel
    • Alva
    • Labelle
    • Estero
    • Matlacha
  • (239) 242-2000
CONTACT US
RRT Logo
  • HOME
  • ABOUT US
  • PROPERTIES FOR SALE
  • SELL YOUR HOME
  • SEARCH BY LOCATION
    • Cape Coral
    • Fort Myers
    • Fort Myers Beach
    • North Fort Myers
    • Lehigh Acres
    • Sanibel
    • Alva
    • Labelle
    • Estero
    • Matlacha
  • (239) 242-2000
CONTACT US
Author: Penny
HomePennyPage 4
lQH58gFo8OT-740×480-1-740×480
Uncategorized
September 8, 2026by Penny

Hyper-local Cape Coral & Fort Myers Real Estate Insights

September 7, 2026 market pulse

Labor Day weekend traditionally marks the beginning of Southwest Florida’s fall real estate season. This year, early momentum is developing in a market that is more balanced, more selective, and increasingly dependent on neighborhood and property type.

Cape Coral and Fort Myers are not moving in exactly the same direction. Cape Coral remains relatively stable, with fewer homes available than a year ago and stronger demand for well-priced single-family and waterfront properties. Fort Myers continues to provide more negotiating room, especially for condos and homes that need updates.

Mortgage rates remain an important part of the conversation. According to Freddie Mac’s Primary Mortgage Market Survey, the 30-year fixed mortgage averaged 6.71% for the week ending September 3, 2026. The 15-year fixed rate averaged 6.04%.

Here is the latest hyper-local look at the Cape Coral market update 2026, Fort Myers real estate trends, and the market for SWFL waterfront homes.

The September 7 market snapshot

The following figures combine the latest available local market data and directional MLS trends. Statistics vary by reporting period, property type, and geographic boundaries.

Metric Cape Coral Fort Myers Lee County
Median sale price Approximately $352,000–$375,000 Single-family: $430,000–$445,000 Varies by segment
Condos Varies by submarket Approximately $220,000–$233,000 Varies by segment
Recent sales activity Approximately 960 homes sold Split between single-family and condos Sales up approximately 7% year over year
Median days on market Approximately 100 days Longer for many condos and older homes Elevated but improving
Months of supply Approximately 4.9 months Single-family: 4.3–4.5 months; condos: 6.5–6.9 months Tightening gradually
Inventory trend Down approximately 25% year over year More balanced in single-family; buyer-leaning in condos Fewer listings than earlier in the year
Sale-to-ask performance Varies by property Varies by property Sellers receiving approximately 93% of asking price
Price reductions Common on stale listings More frequent in buyer-leaning segments Approximately 22% of listings

The overall message is not that the market has suddenly become hot. Instead, the fall season is beginning with fewer choices than last year, steady buyer interest, and a wide gap between properties that are priced correctly and those that are not.

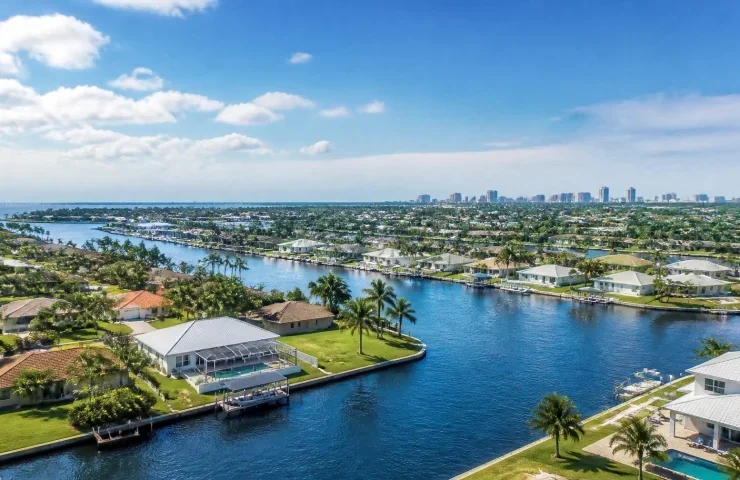
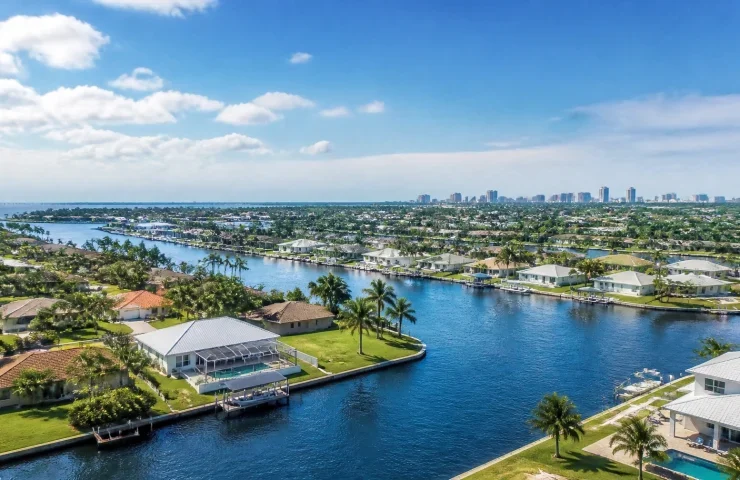
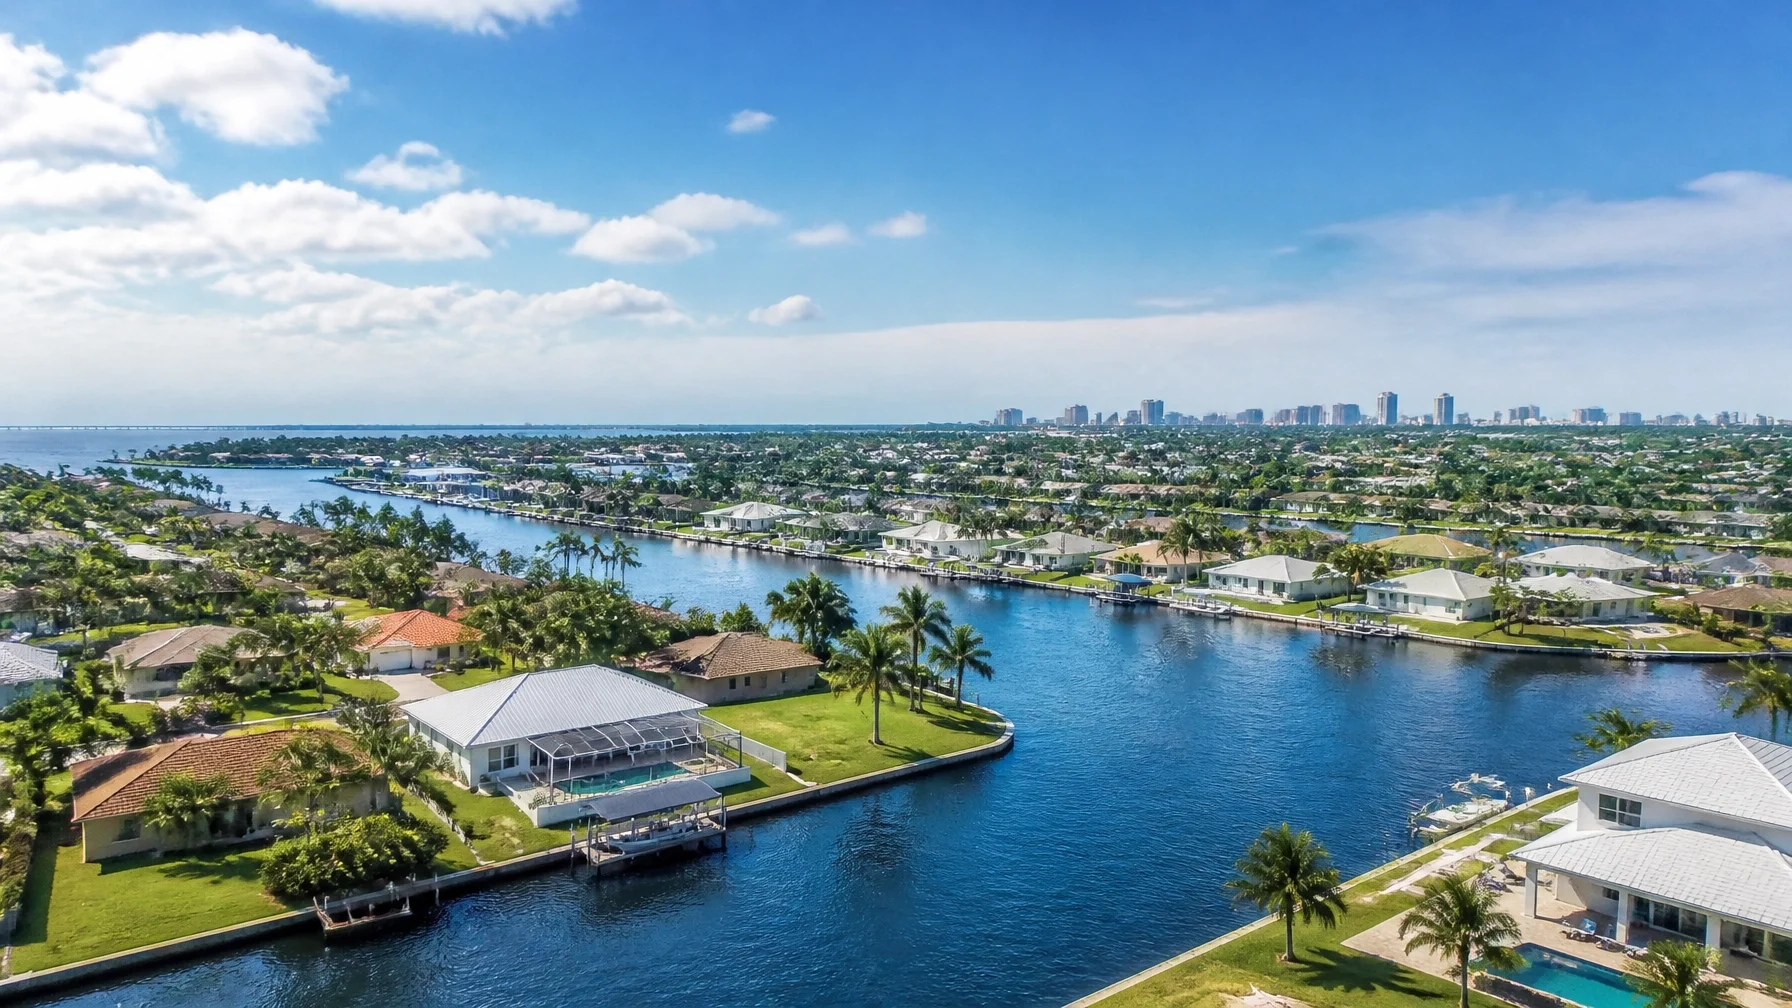
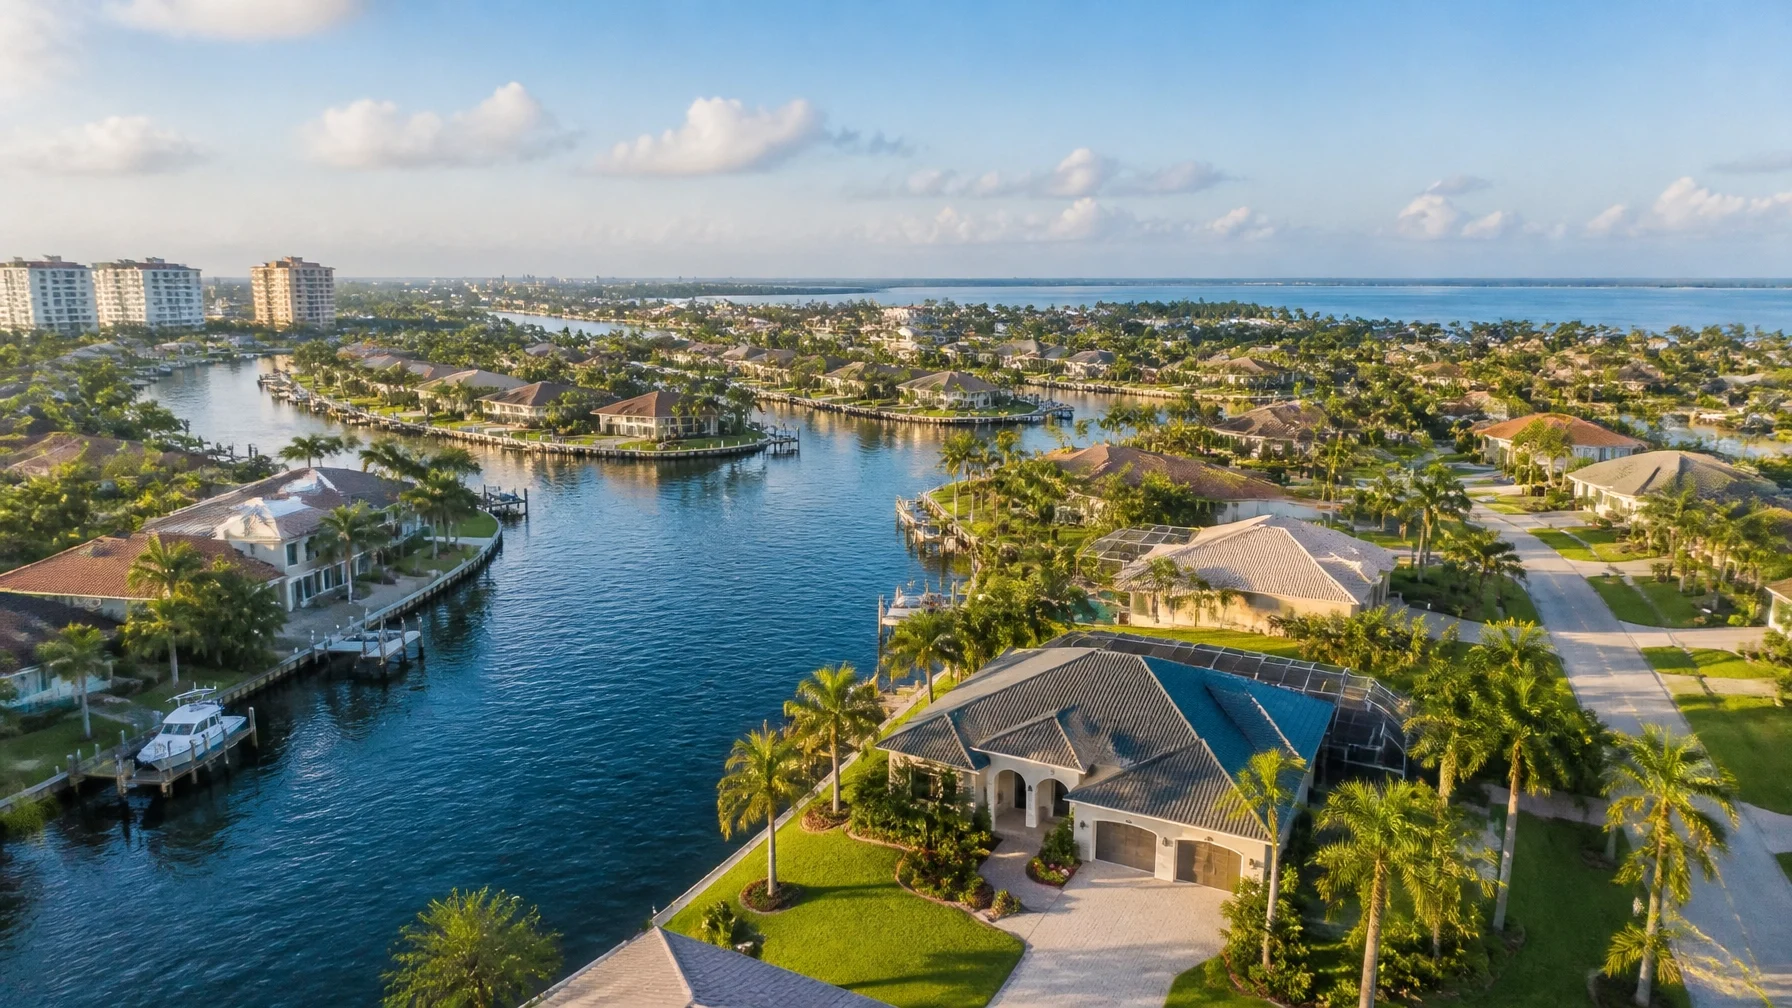
Cape Coral canal homes and waterfront properties in bright natural light

Cape Coral: inventory is tighter, but buyers remain selective

Cape Coral’s median sale price is currently landing somewhere between approximately $352,000 and $375,000, depending on the reporting period and property mix. Roughly 960 homes sold in the latest tracked period, and the typical property has spent about 100 days on the market.

Inventory is down approximately 25% year over year, while absorption is near 4.9 months. That places Cape Coral close to a balanced market overall. It is not the highly competitive environment seen during the pandemic-era boom, but it is also not a market where every seller must accept a steep discount.

The strongest demand remains concentrated in homes with:

  • Updated roofs, electrical systems, and HVAC equipment
  • Pools and attractive outdoor living areas
  • Reasonable insurance profiles
  • Newer construction or completed renovations
  • Desirable canal access or larger lots
  • Convenient access to shopping, restaurants, schools, and major roads

Cape Coral’s size makes neighborhood-level analysis essential. Recent listing medians have illustrated the range:

  • Diplomat: approximately $340,000
  • Mariner: approximately $369,000
  • Burnt Store: approximately $459,000
  • Cape Harbour: approximately $509,000
  • Pelican: approximately $535,000
  • Cape Royal Country Club Estates: approximately $775,000

These figures are listing medians, not appraisals. They can also move substantially when only a small number of homes sell. Still, they show why a buyer comparing northern Cape Coral with Pelican, Cape Harbour, or Cape Royal may be looking at very different markets.

For sellers, the lesson is straightforward: pricing must reflect current competition, not the highest sale from several years ago. For buyers, the tighter inventory trend means the best homes may attract attention quickly, even while less competitive listings remain available for negotiation.

Fort Myers: different conditions for single-family homes and condos

Fort Myers remains more segmented than the citywide median suggests.

Single-family homes are reporting a median sale price of approximately $430,000 to $445,000, with 4.3 to 4.5 months of supply. That is near-balanced territory. Buyers have time to investigate a property and negotiate, but a well-maintained home in a desirable location may still attract multiple interested parties.

Condos are operating differently. Median prices are approximately $220,000 to $233,000, while inventory has expanded to roughly 6.5 to 6.9 months of supply. This gives condo buyers more selection and leverage, particularly when association fees, insurance costs, reserves, or potential assessments are high.

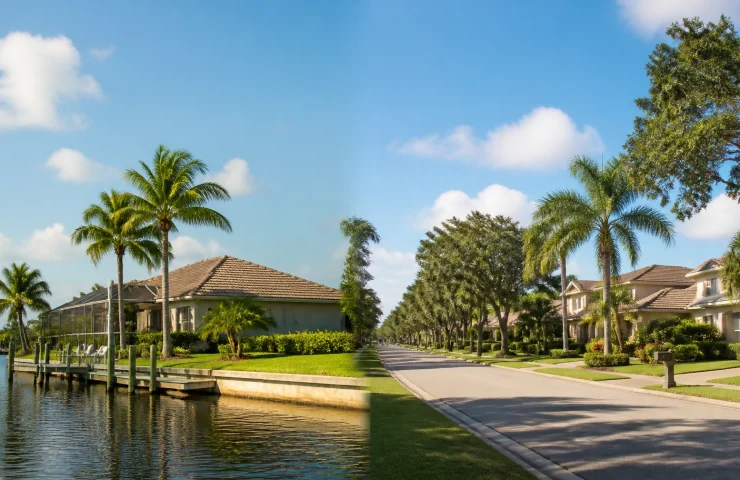
Established Fort Myers neighborhood with mature landscaping and well-maintained homes

Neighborhoods also tell different stories. Established areas such as Whiskey Creek, Briarcliff, and Heritage Palms may attract buyers who value mature landscaping, community amenities, and convenient access to shopping, healthcare, and employment centers. Other areas, including Island Park and older condo communities, may offer lower entry prices but require closer review of condition and carrying costs.

Fort Myers buyers should compare:

  • Monthly homeowners association fees
  • Association reserves and meeting minutes
  • Insurance coverage and deductibles
  • Roof age and building maintenance
  • Rental restrictions
  • Special assessments
  • Flood exposure and elevation
  • The property’s total monthly cost, not just the purchase price

SWFL waterfront homes: price tiers still vary dramatically

Waterfront remains one of the most important distinctions in the Cape Coral market. However, “waterfront” is not a single category.

Approximate price tiers for Cape Coral waterfront properties include:

Waterfront category Approximate price range
Freshwater canal homes Mid-$400,000s and up
Gulf-access homes with bridge restrictions Approximately $600,000–$650,000
Direct Gulf or sailboat access Approximately $700,000–$755,000 and up
Premium riverfront, wide-basin, or extensively upgraded homes $1 million or more

The exact value depends on canal width, bridge clearance, seawall condition, dock and lift improvements, boating route, storm protection, remodeling, lot size, and proximity to open water.

A buyer should ask more than whether a property is labeled “waterfront.” Important questions include:

  • How long does it take to reach the Caloosahatchee River or Gulf?
  • Are there bridges or height restrictions?
  • Is the seawall permitted and structurally sound?
  • Are the dock and lift insurable?
  • What flood insurance is required?
  • Has the property experienced storm damage?
  • Are short-term rentals permitted?

The least expensive waterfront home may not provide the most useful boating access. Likewise, a higher-priced property may justify its premium if it offers direct access, a newer seawall, a protected basin, or a more desirable location.

Mortgage rates and the September 15–16 FOMC meeting

At 6.71%, the current 30-year fixed rate continues to influence affordability. The 15-year rate of 6.04% may appeal to buyers who want to pay down principal more quickly, but the higher monthly payment requires careful budgeting.

The Federal Reserve’s September 15–16 FOMC meeting will be closely watched. The Fed does not directly set mortgage rates, but its policy decisions and economic guidance can affect bond markets and longer-term borrowing costs.

If rates ease after the meeting, some buyers may return to the market or gain additional purchasing power. If rates remain elevated, buyers are likely to continue emphasizing price, seller concessions, rate buydowns, and lower-cost properties.

The practical advice is to make decisions based on the payment you can afford today. Refinancing may become an option later, but it should not be the foundation of a purchase decision.

Insurance remains a major part of affordability

Insurance must be addressed early, particularly for coastal, older, waterfront, elevated, and condo properties.

Recent Citizens Property Insurance changes included an average decrease for some multiperil policies and a separate reduction for certain wind-only policies. The impact varies by property, coverage type, deductible, mitigation features, roof age, location, and prior claims history. Buyers should review Citizens Property Insurance resources and obtain a property-specific quote before the inspection period expires.

A complete housing budget should include:

  • Homeowners insurance
  • Wind and flood coverage
  • Property taxes
  • HOA or condo fees
  • Utilities
  • Maintenance
  • Seawall, dock, or pool expenses
  • Reserves for major repairs

Home-buying due diligence with keys, inspection materials, and insurance documents

Strategy for buyers, sellers, and investors

For buyers

The fall market may offer more negotiating room than the fastest-moving years, but preparation still matters.

  • Get fully pre-approved before touring homes.
  • Compare recent closed sales rather than relying on asking prices.
  • Review price reductions and total days on market.
  • Request insurance estimates early.
  • Investigate permits, roofs, seawalls, docks, and storm repairs.
  • For condos, review reserves, assessments, rental rules, and association finances.
  • Consider both Cape Coral and Fort Myers if your lifestyle and commute allow flexibility.

For sellers

The post-Labor Day season can bring more activity from seasonal residents, relocating households, and second-home buyers. However, buyers are informed and have alternatives.

Sellers should:

  • Price against current comparable homes.
  • Complete high-impact repairs before listing.
  • Gather roof, permit, insurance, and renovation records.
  • Present outdoor spaces and waterfront features clearly.
  • Explain bridge clearance, boating access, and seawall condition.
  • Monitor showing activity during the first two weeks.
  • Be prepared to adjust if the market provides negative feedback.

For investors

Investors should underwrite the entire property rather than focusing only on purchase price.

Include realistic rent, vacancy, management, insurance, taxes, HOA fees, repairs, utilities, financing, and capital reserves. Cape Coral waterfront homes may have strong lifestyle and rental appeal, but seawalls, lifts, flood exposure, and insurance can materially affect returns. Fort Myers condos may provide a lower entry price, but association restrictions and assessments require careful review.

The bottom line for September 7, 2026

Southwest Florida is entering its fall market with improving momentum but continued segmentation.

Cape Coral is close to balanced: inventory is down approximately 25% year over year, absorption is near 4.9 months, and well-priced single-family and waterfront homes can attract serious attention.

Fort Myers is split: single-family homes are near-balanced with 4.3 to 4.5 months of supply, while condos remain more buyer-friendly with 6.5 to 6.9 months of supply.

Across Lee County, sales are up approximately 7% year over year, sellers are capturing about 93% of asking price, and roughly 22% of listings have experienced price cuts. That combination points to a market that is active: but still rewards realistic pricing and careful analysis.

The key takeaway is simple: the citywide median is only the beginning. Neighborhood, property type, insurance profile, waterfront access, condition, and financing costs will determine the right strategy.

Search available Southwest Florida properties, meet the RE/MAX Realty Team, or contact our office for guidance from local cape coral real estate agents and experienced realtors cape coral buyers and sellers can trust throughout Cape Coral, Fort Myers, Sanibel, Fort Myers Beach, and surrounding communities.

Market figures are approximate and may vary by source, reporting period, property type, and geographic boundaries. This article is for general informational purposes only and is not an appraisal, insurance quote, lending decision, or substitute for individualized real estate, legal, tax, insurance, or financial advice.
Read More
rNR6H1lPJa8
Uncategorized
September 7, 2026by Penny

Hyper-local Cape Coral & Fort Myers Real Estate Insights

Market pulse for the week of September 7, 2026

September brings a seasonal crossroads to Southwest Florida real estate. Historically, it is one of the quietest transaction months of the year, as buyers and sellers settle into post-Labor Day routines. At the same time, Atlantic hurricane season reaches its climatological peak, mortgage rates are pressing toward 7%, and the Federal Open Market Committee is scheduled to meet September 15–16.

Those factors are creating a market that rewards preparation rather than urgency. Buyers have selection and negotiating room, but financing and insurance costs still deserve careful attention. Sellers can attract serious interest, but pricing and property presentation matter more than they did during the fast-moving years of 2021 and 2022.

Here is the latest approximate snapshot based on MLS and licensed-market data where applicable.

Market at a glance: Lee County

Lee County remains more balanced than it was during the inventory surge, although buyers still have meaningful choices:

  • Median sale price: Approximately $375,000, down about 3% year over year
  • Active MLS listings: Approximately 9,304 at the end of August
  • Median time to contract: Approximately 60 days
  • Seller proceeds: About 93.4% of the original asking price, on average
  • Listings with price reductions: Approximately 22%
  • Market direction: More balanced overall, with buyer leverage in several segments

Inventory has eased from its peak, but this is not a market where every well-priced home sells immediately. Condition, location, flood exposure, insurance availability, property type, and pricing strategy can make a substantial difference.

Mortgage rates are another important part of the equation. According to Freddie Mac’s Primary Mortgage Market Survey, the average 30-year fixed mortgage rate was approximately 6.71% for the week ending September 3, up from 6.66% the prior week and 6.50% a year earlier. The 15-year fixed rate was near 6.04%.

The September 15–16 FOMC meeting will be closely watched, but buyers should remember that mortgage rates do not move in lockstep with the Federal Reserve’s overnight policy rate. They are influenced more directly by the 10-year Treasury, inflation expectations, bond-market conditions, and the broader economic outlook. A rate decision or press conference could affect market sentiment, but it will not automatically produce an immediate drop in mortgage rates.

Cape Coral: balanced market, highly local outcomes

Cape Coral is roughly balanced overall, with an approximate median sale price near $375,000, up a modest 0.4% year over year. New construction represented about 24% of recent sales, which continues to give buyers an alternative to existing homes.

However, citywide statistics only tell part of the story. A direct Gulf-access home near the Caloosahatchee River behaves very differently from an off-water resale several miles inland. Buyers comparing those properties need to evaluate them as separate market segments, not as interchangeable Cape Coral homes.

For example:

  • An off-water home may compete primarily on price, condition, age, layout, and proximity to shopping or schools.
  • A freshwater canal home may appeal to buyers seeking water views, kayaking, or a private dock without the cost of Gulf access.
  • A Gulf-access property is also evaluated on canal depth, bridge clearance, boating time, seawall condition, dock improvements, and the route to open water.
  • A newer construction home may include warranties, modern storm protection, and energy-efficient systems that influence its value beyond the basic sale price.

This is where working with experienced Cape Coral real estate agents becomes especially important. The best comparison is often not the nearest listing: it is the most similar home in terms of water access, construction age, flood zone, improvements, and insurance profile.

Buyers searching for realtors Cape Coral should look for professionals who can explain these distinctions clearly and connect the purchase price to long-term ownership costs.

Cape Coral canal-front home with a dock and screened lanai

Fort Myers: more leverage for prepared buyers

Fort Myers is currently more buyer-leaning than Cape Coral. The approximate median sale price is $348,000, down about 6.1% year over year, with homes taking approximately 64 days to go under contract.

Cash buyers represented roughly 52% of Fort Myers sales, compared with approximately 28% in Cape Coral. That cash presence can make certain neighborhoods and price points more competitive, but it does not eliminate negotiation. Buyers are negotiating approximately 9% below asking on average, depending on the property type and the difference between the initial list price and the home’s realistic market value.

For buyers, this may create opportunities to negotiate on:

  • Price
  • Closing costs or rate-buydown contributions
  • Repairs and credits
  • Inspection-related items
  • Closing dates
  • Personal property or furnishings, where appropriate

For sellers, the data reinforces the importance of entering the market with a realistic price from day one. A home that starts too high may accumulate days on market, require multiple reductions, and ultimately attract less attention than a comparable property priced correctly at launch.

The broader Fort Myers real estate trends also vary by neighborhood. Downtown-adjacent condos, established single-family communities, golf-course properties, and homes closer to the river or coast can have very different buyer pools and timelines.

SWFL waterfront homes: value depends on access and carrying costs

Waterfront property remains one of Southwest Florida’s strongest lifestyle draws, but “waterfront” is not a single category.

Approximate pricing tiers currently include:

  • Freshwater canal homes: Often in the mid-$400,000s
  • Gulf-access homes with bridge restrictions: Frequently in the $600,000s
  • Direct or sailboat-access homes: Commonly in the high-$600,000s to $700,000s and above
  • Premium riverfront, wide-basin, or extensively upgraded homes: Often above $1 million

These are broad ranges, not appraisals. A home’s price can change substantially based on seawall age, dock and lift condition, pool, roof, storm protection, water depth, bridge restrictions, lot orientation, renovations, and boating distance.

Many waterfront homes should be marketed with a realistic window of approximately 70–100 days or more, particularly when they are priced above the median or require specialized insurance underwriting. Buyers should also budget time for inspections that go beyond the typical home inspection, including seawall, dock, roof, elevation, electrical, and wind-mitigation reviews.

Insurance is central to the waterfront decision. The approximate average annual homeowners premium in Lee County is $2,197, although actual costs can vary dramatically by home age, construction, roof, wind mitigation, flood exposure, coverage limits, deductible, and whether the property is on a canal or open water.

Citizens Property Insurance approved an average rate decrease of approximately 8.7%, effective July 1, 2026, and Lee County had roughly 6,508 Citizens policies in force in the referenced data. The decrease is encouraging, but buyers should never assume that a statewide or countywide average will match a specific property’s quote.

Hurricane-season and insurance awareness

September is the climatological peak of Atlantic hurricane season. That does not mean a storm will affect Southwest Florida, but it does mean buyers and owners should treat preparation as part of responsible real estate planning.

Before purchasing, request insurance quotes early: especially for waterfront homes, older homes, homes with older roofs, and properties with unusual construction or additions. Ask about wind mitigation credits, flood insurance, deductibles, roof age requirements, and coverage limitations.

A strong real estate decision is not based only on whether a home fits the budget at closing. It also considers the recurring costs of insurance, flood coverage, utilities, maintenance, seawalls, docks, and reserves for future repairs.

What buyers should do now

The September market can reward buyers who are organized:

  1. Get an updated preapproval. A rate near 6.71% can produce a different monthly payment than an earlier estimate.
  2. Compare total monthly ownership costs. Include taxes, insurance, flood coverage, HOA fees, utilities, and maintenance.
  3. Separate price from value. A lower-priced home may need a roof, seawall, HVAC system, or major insurance investment.
  4. Use the FOMC meeting as information, not a deadline. Waiting for a rate announcement may or may not improve your financing outcome.
  5. Compare neighborhoods and property types carefully. Cape Coral off-water, freshwater, and Gulf-access homes are distinct markets.
  6. Build negotiation terms into the offer. Price is only one part of a successful contract.

What sellers should expect

Sellers should expect buyers to be more analytical. They are comparing not only list prices but also price reductions, days on market, insurance quotes, inspection findings, and likely resale value.

A strong listing strategy should include accurate pricing, high-quality photography, clear disclosure of improvements, documentation for roofs and storm protection, and a thoughtful explanation of waterfront features. If your property has a newer roof, updated electrical system, seawall improvements, wind mitigation, or favorable flood characteristics, make those details easy for buyers and their agents to understand.

The goal is not simply to be listed. It is to be the most compelling option among the homes buyers can see today.

A note for investors

Investors should underwrite conservatively in the current environment. Mortgage rates near 7%, insurance costs, maintenance, vacancy, property management, and local rental demand all affect the actual return.

Cape Coral and Fort Myers may offer opportunities, but investors should avoid relying on rapid appreciation to make a deal work. Analyze the property using realistic rents, realistic repair costs, conservative financing assumptions, and an adequate reserve fund. Waterfront rentals also require careful review of flood exposure, dock maintenance, storm preparation, and local regulations.

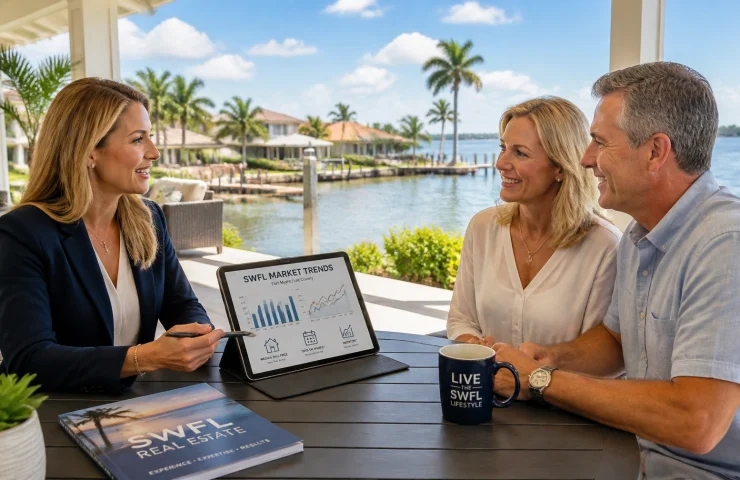
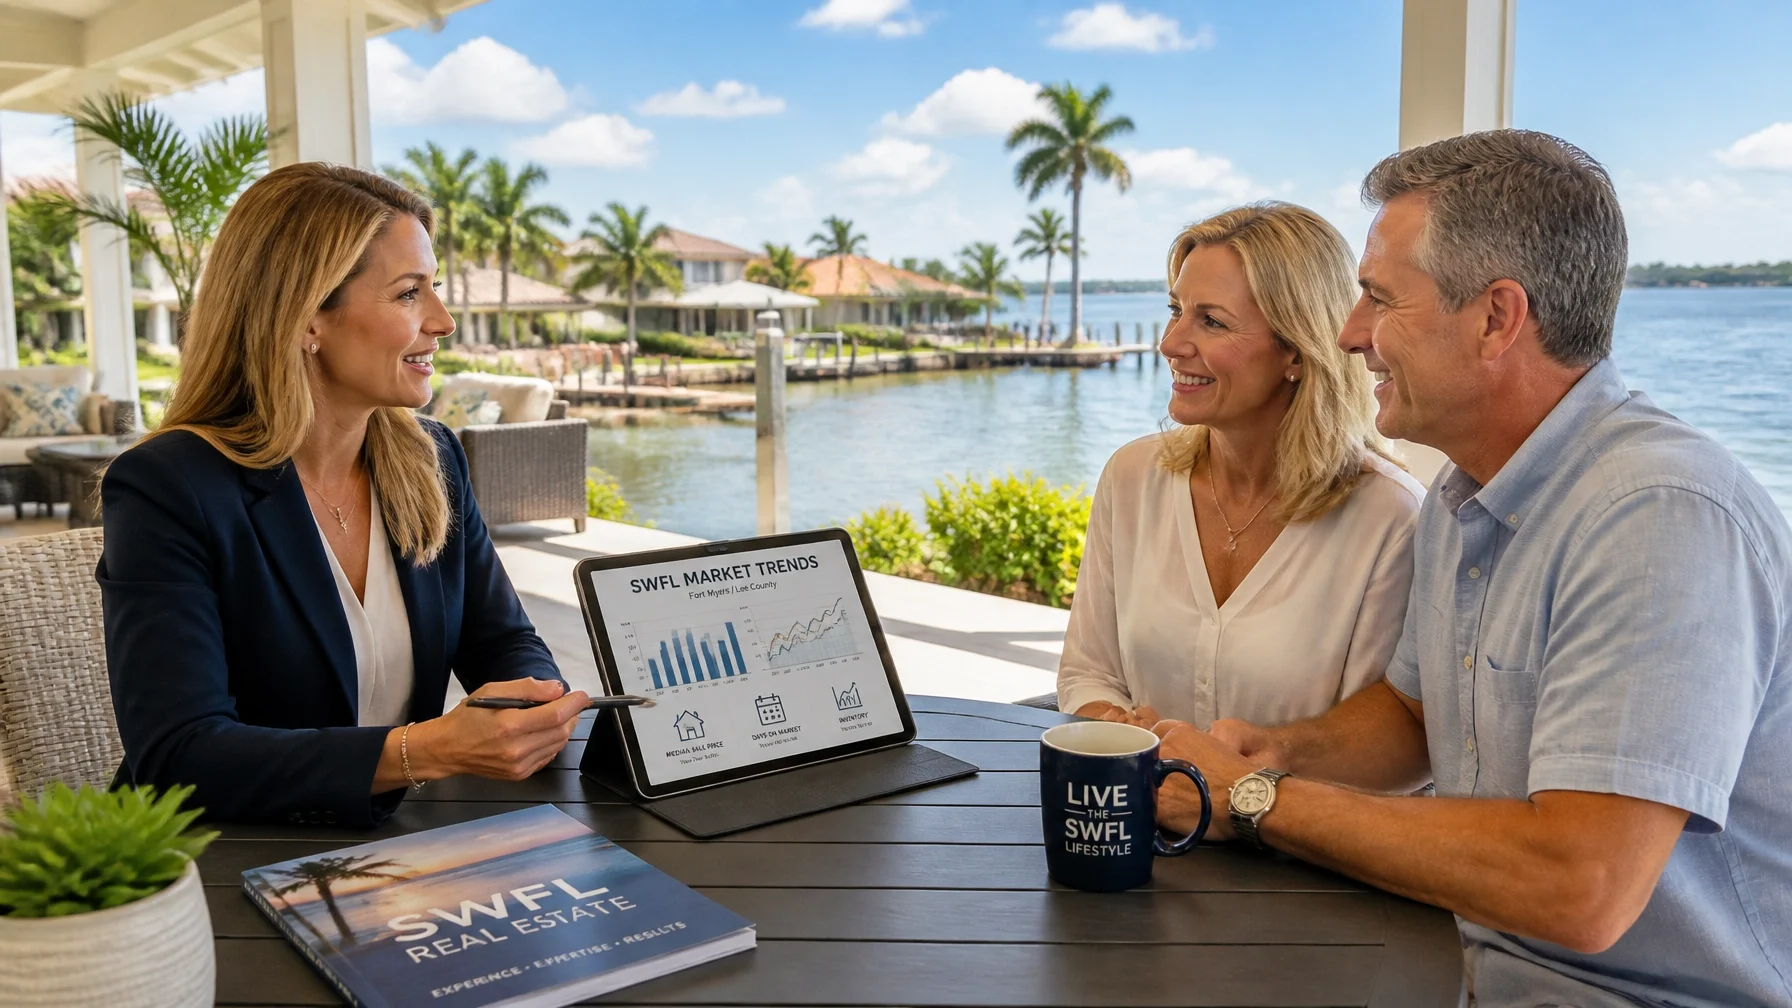
Real estate agent meeting with Southwest Florida buyers to review a market report

Bottom line: September favors informed decisions

The Cape Coral market update 2026 story is not one-size-fits-all. Lee County is more balanced, Cape Coral is relatively steady with wide neighborhood variation, and Fort Myers is giving prepared buyers more leverage. Mortgage rates are pressing toward 7%, the September FOMC meeting may influence expectations, and hurricane-season awareness makes insurance and property condition especially important.

For buyers, the opportunity is choice and negotiation. For sellers, the opportunity is to stand out through accurate pricing and preparation. For investors, the opportunity is selective: but only when the numbers work without relying on optimistic assumptions.

If you are considering a move, sale, investment, or waterfront purchase, connect with the RE/MAX Realty Team. Our 100+ agents bring local knowledge across Cape Coral, Fort Myers, Sanibel, Fort Myers Beach, and surrounding Southwest Florida communities. As the #1 producing brokerage in the region, we are ready to help you evaluate the market and take the next step with confidence.

Search available Southwest Florida properties.

Read More
lQH58gFo8OT-740×480-1-740×480
Uncategorized
September 5, 2026by Penny

Hyper-local Cape Coral & Fort Myers Real Estate Insights

First week of September 2026 | Market pulse refreshed September 4, 2026

Mortgage rates moved higher as fall begins. The average 30-year fixed rate reached 6.71%, up from 6.66% the previous week and the highest level since July 31, 2025. The 15-year fixed rate rose to 6.04%.

At the same time, the Federal Open Market Committee is scheduled to meet September 15–16. That timing may tempt buyers to pause and wait for a possible change in the federal funds rate. But mortgage rates do not move one-for-one with the Fed’s policy rate. Fixed mortgage rates are influenced more directly by the 10-year Treasury yield, inflation expectations, and investor demand for mortgage-backed securities.

So the practical question for Southwest Florida buyers and sellers is not simply, “What will the Fed do?” It is: What do this week’s numbers mean as the fall market begins?

The answer is a market with opportunity: but one that rewards preparation, realistic pricing, and careful attention to carrying costs.

The September market at a glance

The latest licensed MLS data show a clear difference between Cape Coral and Fort Myers, even though both are part of the broader Lee County market.

Market indicator Cape Coral Fort Myers
Median sale price Approximately $375,000 Approximately $348,000
Year-over-year price change Up approximately 0.4% Down approximately 6.1%
Sold price per square foot Approximately $220 Approximately $203
Sellers’ share of original asking price Approximately 94.2% Approximately 91.4%
Median days to contract Approximately 52 days Approximately 64 days
Momentum score 56/100 : balanced 40/100 : buyer-leaning
New construction share of recent sales Approximately 24% Approximately 4%
Cash-buyer share Approximately 28% Approximately 52%

Cape Coral is showing more price stability, supported in part by continued new-construction activity and demand for canal-front homes. Fort Myers is giving buyers more leverage, with softer pricing, longer marketing times, and a greater share of cash purchases.

For context, Lee County’s median sale price is approximately $375,000, down about 3% year over year. There were approximately 9,304 active MLS listings at the end of August. Sellers captured about 93.4% of original asking price, and the median time to contract was approximately 60 days. About 22% of listings had experienced a price cut.

Zillow’s for-sale inventory stood near 11,185 homes, down approximately 6.6% month over month, while the county’s typical home value was approximately $337,352, down about 5.4% year over year. July CoStar/Homes.com data also showed Fort Myers MSA sales up approximately 14.5% year over year, with a median price near $358,000 and inventory at its lowest level of 2026.

The takeaway: inventory has eased from its peak, but buyers still have choices: and sellers must compete.

Cape Coral: balanced, but very neighborhood-specific

Cape Coral’s overall momentum score of 56 suggests a balanced market. However, conditions vary significantly by location, property type, water access, age, and condition.

New construction represents approximately 24% of recent Cape Coral sales, making builders an important part of the competitive landscape. Buyers may compare an existing home not only with nearby resale properties but also with builder incentives, rate buydowns, warranties, and design selections.

Neighborhood-level numbers reinforce the importance of hyper-local analysis:

  • Rose Garden: approximately $850,000, up about 39% year over year; homes selling in roughly nine days.
  • Yacht Club: approximately $617,000, up about 14%.
  • Palaco Grande: up approximately 22%.
  • Cape Harbour: approximately $512,000, down about 20%.
  • Tarpon Landings: down approximately 24%, although the sample size is thin.

These figures should not be treated as guarantees for every property. A handful of sales can move the median sharply in a smaller neighborhood. Still, they show why broad headlines about “the Cape Coral market” are not enough. A direct Gulf-access home in one boating community may be behaving very differently from an off-water resale home several miles away.

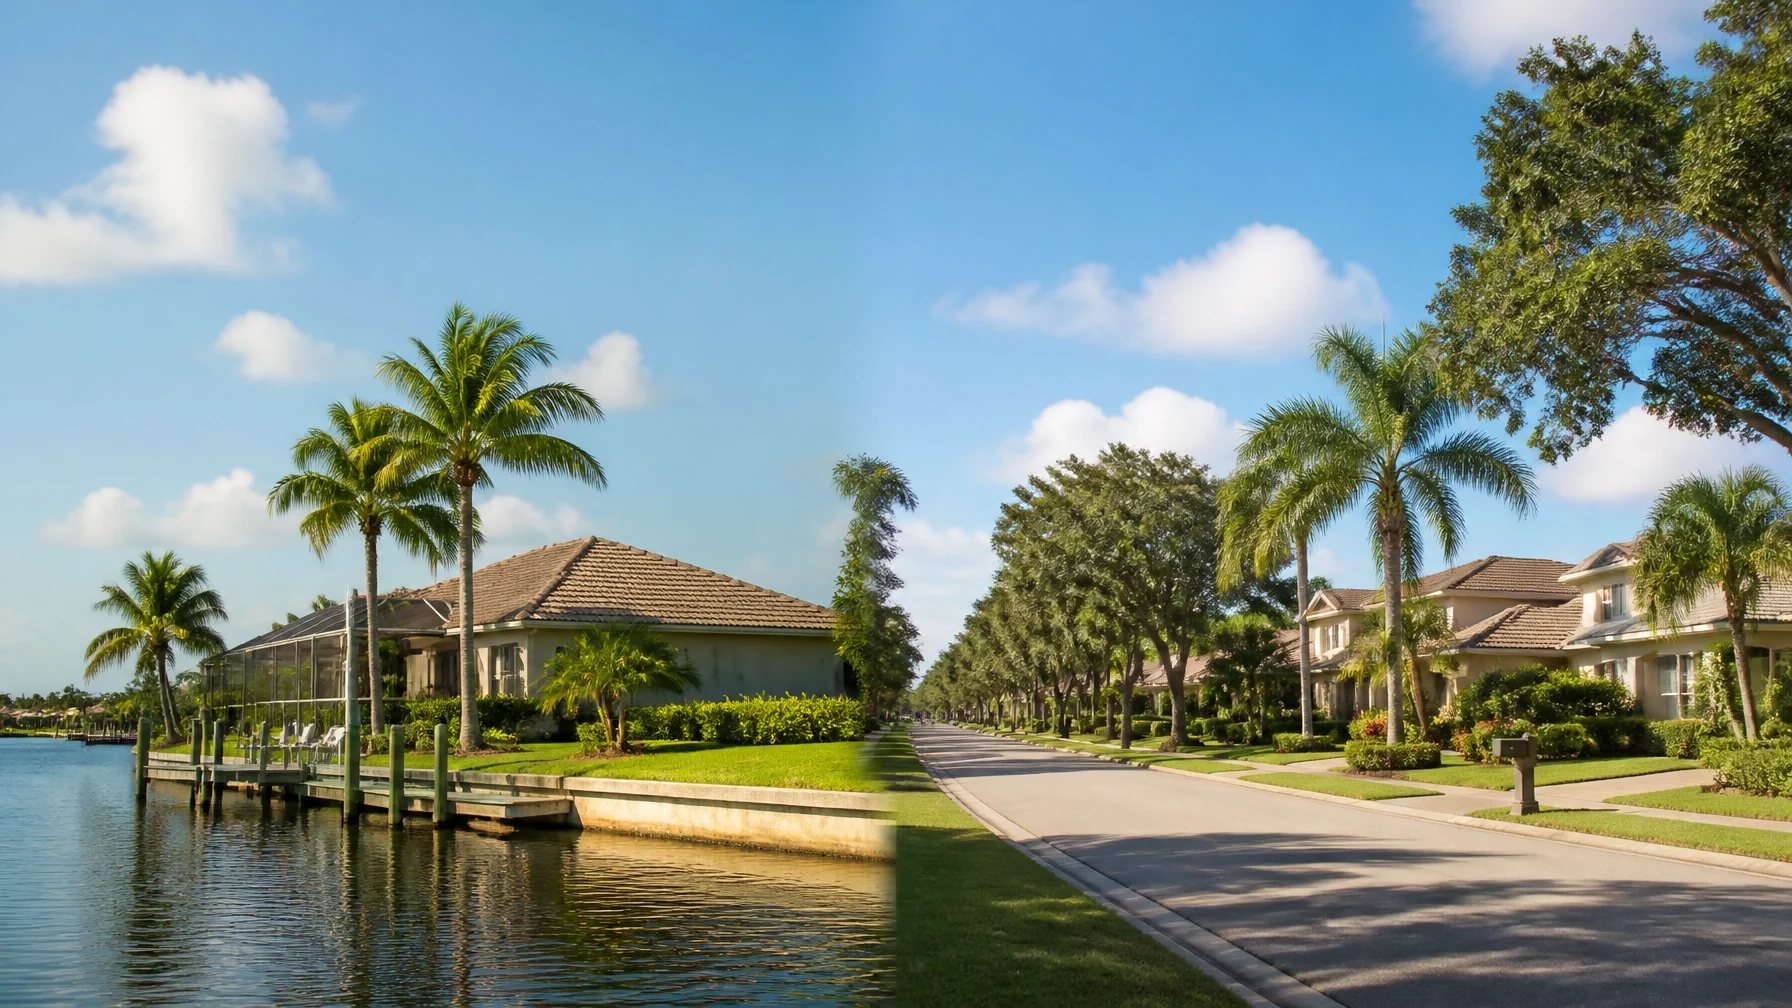
Bright Southwest Florida neighborhood with canal-front homes and palm-lined streets

Fort Myers: more negotiating room for prepared buyers

Fort Myers is currently more buyer-leaning, with a momentum score of 40/100. The median sale price is approximately $348,000, down about 6.1% year over year, and the typical property takes approximately 64 days to reach a contract.

Buyers are negotiating roughly 9% below asking price in the current market, although the discount varies widely. A well-priced, updated home in a desirable neighborhood may still attract strong interest. A property with deferred maintenance, high insurance costs, or an ambitious list price may sit considerably longer.

Fort Myers also has a much higher cash-buyer share: approximately 52%: than Cape Coral’s 28%. That creates a different competitive environment. Cash buyers may be especially active in lower-priced homes, investment properties, and homes requiring repairs. Financing buyers can still compete, but they should be fully underwritten and ready to move when the right property appears.

Fort Myers neighborhood movers include:

  • Heritage Palms Estates: approximately $856,000; selling in about five days.
  • Whiskey Creek: approximately $514,000; selling in about six days.
  • Briarcliff: approximately $810,000; selling in about seven days.
  • The Forest: approximately $730,000, up about 21%.
  • Island Park Village: down approximately 47% on a thin sample.

Again, these neighborhood figures require context. Small samples, changes in the mix of homes sold, renovations, and waterfront exposure can all affect year-over-year comparisons.

SWFL waterfront homes: price tiers matter

Waterfront buyers should focus on the type and quality of access: not simply the word “waterfront” in a listing description.

Current pricing generally falls into these broad ranges:

  • Freshwater canal homes: often in the mid-$400,000s.
  • Gulf-access homes with bridge restrictions: frequently in the $600,000s.
  • Direct or sailboat-access homes: commonly in the high $600,000s to $700,000s and above.
  • Premium riverfront, wide-basin, or extensively upgraded properties: often above $1 million.

A realistic marketing window for many SWFL waterfront homes is approximately 70–100 days or more, depending on price, insurance, access, condition, and presentation. Desirable properties can move quickly, but sellers should not assume every waterfront listing will receive immediate offers.

Buyers should verify:

  • The actual boating route to open water
  • Bridge heights and clearance restrictions
  • Seawall, dock, lift, and electrical condition
  • Permits for seawalls, docks, lifts, pools, and additions
  • Flood zone and elevation information
  • Wind, flood, and homeowners insurance quotes

Insurance is part of the waterfront purchase decision, not an afterthought. The average annual homeowners premium in Lee County is approximately $2,197, although an individual property’s cost can vary substantially based on age, construction, mitigation features, location, roof, flood exposure, and coverage limits.

Citizens Property Insurance has approximately 6,508 policies in force in Lee County. Its first average rate decrease since 2015: approximately 8.7%: took effect July 1, 2026. Even with that change, buyers should obtain property-specific quotes before the inspection or due-diligence period expires.

Southwest Florida buyers reviewing market information with a real estate professional

What buyers should do this fall

Shop the market, not the Fed

If a home meets your needs and the payment works within your budget, waiting solely for the September FOMC meeting may not improve your position. Mortgage rates could move lower, remain steady, or rise depending on Treasury markets and economic expectations.

A future refinance may be possible, but the price, financing terms, and seller concessions available today are concrete factors.

Underwrite the full carrying cost

Before making an offer, estimate:

  • Principal and interest
  • Homeowners insurance
  • Flood insurance, if required or advisable
  • Property taxes
  • HOA or condo fees
  • Utilities and routine maintenance
  • Pool, seawall, dock, and boat-lift expenses
  • Possible storm-related repairs

This is especially important for waterfront homes and properties in communities with substantial reserves or upcoming assessments.

Compare closed sales: not just asking prices

Recent closed sales provide the most useful pricing evidence. Ask your agent to compare similar homes by neighborhood, living area, lot, water access, age, renovations, and condition.

In the current market, buyers may also consider requesting a temporary rate buydown, seller-paid closing costs, repair credits, or other concessions. The best strategy depends on the property and the seller’s priorities.

What sellers should expect

Sellers should price against today’s competition, including new construction in Cape Coral. A home that was competitive last year may now be compared with a builder offering incentives or a newer property with lower expected maintenance.

In Fort Myers especially, sellers should expect negotiation. Rate buydowns, closing-cost assistance, repair credits, and warranties are back on the table. These concessions can help a buyer manage the higher payment created by a 6.71% mortgage rate without requiring the seller to make a large headline price reduction.

The first two weekends matter. Strong photography, accurate pricing, easy showing access, clean presentation, and a clear explanation of insurance and improvements can help a listing stand out before it accumulates days on market.

A note for investors

Cash-buyer competition differs sharply between Cape Coral and Fort Myers. Investors should examine more than purchase price and projected rent. Review rental demand by neighborhood, seasonality, flood and insurance costs, property management fees, HOA rules, rental restrictions, reserves, and pending assessments.

For condominiums and gated communities, read the association documents carefully. The most attractive projected return can change quickly when insurance premiums, reserves, or maintenance obligations are higher than expected.

The bottom line for September 2026

Cape Coral is broadly balanced, with relatively stable pricing and meaningful new-construction competition. Fort Myers is more buyer-leaning, with greater negotiating room and a larger cash-buyer presence. Lee County overall offers more selection than a tight seller’s market, but the best homes: particularly well-priced waterfront and turnkey properties: can still move quickly.

Mortgage rates are now at 6.71% for a 30-year fixed loan, and the September FOMC meeting may influence market expectations. But buyers should shop the market rather than wait on the Fed. The right decision depends on the full monthly cost, the quality of the property, the negotiated terms, and your personal timeline.

For local guidance from experienced Cape Coral real estate agents and realtors in Cape Coral, Fort Myers, Sanibel, Fort Myers Beach, and surrounding communities, connect with RE/MAX Realty Team. With more than 100 real estate professionals and deep knowledge of Southwest Florida, our team can help you evaluate the numbers and move forward with confidence.

Search available Southwest Florida properties or contact our office to discuss your next move.

Market figures are approximate and based on licensed MLS data refreshed September 4, 2026. Neighborhood statistics may reflect small sample sizes and should be evaluated with a property-specific comparative market analysis.

Read More
lQH58gFo8OT-740×480
Uncategorized
September 4, 2026by Penny

Hyper-local Cape Coral & Fort Myers Real Estate Insights

Updated September 3, 2026

Cape Coral and Fort Myers are no longer moving in lockstep with the rapid-growth market of a few years ago. Instead, Southwest Florida has entered a more balanced phase, where pricing, property type, location, insurance costs, and waterfront access all play a larger role in the outcome of a transaction.

For buyers, this means more choice and negotiating room in several segments. For sellers, it means accurate pricing and strong presentation matter more than simply listing high and waiting. For investors and second-home buyers, the opportunity is real: but the numbers need to be evaluated property by property.

Here is the latest hyper-local look at the Cape Coral market update 2026, Fort Myers real estate trends, and the market for SWFL waterfront homes.

Cape Coral market update 2026: A balanced market with meaningful variation

According to Realtor.com’s August 2026 Cape Coral market data, the city had approximately 5,910 homes for sale, a median listing price of $414,173, and a median sold price of $383,000. Homes spent a median of 85 days on the market, while the average sale-to-list price ratio was about 97%.

Realtor.com classified Cape Coral as a balanced market, meaning neither buyers nor sellers have a decisive overall advantage. However, the citywide numbers only tell part of the story.

A separate April 2026 single-family report using Florida Gulf Coast MLS data showed:

  • Median sale price: $381,000
  • Closed sales: 552
  • Median days on market: 44
  • List price received: 97.3%
  • Active inventory: 2,584 homes
  • Months of supply: 4.7

That April report also showed closed sales increasing year over year while active inventory and months of supply declined. In practical terms, well-priced single-family homes were attracting buyers faster than the broader citywide average.

The difference between 44 days and 85 days is a reminder that market statistics depend heavily on the reporting period and property mix. A citywide number may include condos, villas, luxury homes, waterfront properties, and listings that have already undergone one or more price reductions.

RE/MAX Realty Team agent reviewing Southwest Florida market trends with clients

Cape Coral neighborhoods are telling different stories

Cape Coral is a large and diverse city. Prices and marketing times can change considerably from one area to another.

August listing data showed approximate median prices such as:

  • Diplomat: $339,900
  • Mariner: $369,000
  • Burnt Store: $458,800
  • Pelican: $534,950
  • Cape Harbour: $509,225
  • Cape Royal Country Club Estates: $774,500

These are listing medians, not appraisals or guarantees of value. Still, they illustrate why buyers should compare homes within the same neighborhood, property type, construction era, and waterfront category.

ZIP codes also show a wide range:

  • 33909: approximately $342,500 median listing price
  • 33993: approximately $399,702
  • 33904: approximately $400,000
  • 33914: approximately $539,000

For buyers, this creates opportunities to adjust the search based on priorities. A buyer who wants a newer home, more living space, or a larger lot may find better value in northern Cape Coral. Someone prioritizing Gulf access, mature landscaping, restaurants, or proximity to the Caloosahatchee River may focus farther south and west: but should expect a different price range.

For sellers, neighborhood-level analysis is essential. A comparable sale several miles away may not reflect the value of a home with different canal access, flood exposure, road proximity, updates, or community amenities.

SWFL waterfront homes remain a separate market

Cape Coral’s waterfront market continues to behave differently from its non-waterfront segment. Buyers have more choices, but not every waterfront property offers the same lifestyle or boating value.

Recent 2026 market analyses place the median sale price for canal waterfront single-family homes near $610,000, while Gulf-access waterfront homes have been reported closer to $755,000 over selected 120-day periods. Other market summaries show a broader range depending on access and property condition.

A useful way to think about the segment is by category:

  • Freshwater canal homes: Often priced in the mid-$400,000s, depending on the home and canal setting
  • Gulf-access homes with bridge restrictions: Frequently in the $600,000 range, with boating limitations varying by route
  • Direct or sailboat-access homes: Commonly in the upper-$600,000s to $700,000s and higher
  • Premium riverfront, wide-basin, or highly upgraded homes: May exceed $1 million

Waterfront homes can also take longer to sell. A realistic marketing window for many canal and Gulf-access properties is approximately 70 to 100 or more days, particularly when the list price does not reflect current competition.

Buyers should evaluate more than the view. Important questions include:

  • How quickly can a boat reach open water?
  • Are there bridges, locks, or height restrictions?
  • Is the seawall in good condition?
  • Are the dock, lift, and electrical systems permitted and insurable?
  • What are the flood zone and elevation considerations?
  • How do homeowners insurance and flood insurance affect the monthly cost?
  • Is the home suitable for seasonal, long-term, or short-term rental use?

The phrase “waterfront” is not specific enough by itself. Two homes may both be advertised as waterfront while offering very different boating access, maintenance costs, and resale appeal.

Fort Myers real estate trends: Cooling, active, and highly location-dependent

Fort Myers is also showing a more measured market in 2026. Current market reporting places the city’s blended median sale price roughly between $330,000 and $350,000, depending on the reporting period and whether the data includes condos, villas, and single-family homes.

Realtor.com’s August 2026 Fort Myers market data characterized the city as a cooler market, with homes taking approximately 93 days on the market and selling for about 4.5% below asking price on average. Inventory was estimated at around five months of supply, placing the market near balanced to slightly buyer-leaning conditions.

These numbers support several important Fort Myers real estate trends:

  1. Buyers have time to compare options.
    Multiple properties may be available in similar price ranges, especially among condos, older homes, and higher-priced listings.

  2. Condition and location are increasingly important.
    Move-in-ready homes near popular corridors may perform better than properties requiring major repairs or insurance upgrades.

  3. Property type affects the headline number.
    A downtown condo, a Gateway-area home, a McGregor corridor property, and a home near the river may all have different buyer pools and pricing dynamics.

  4. Sellers need a plan for negotiations.
    Credits for closing costs, repairs, rate buydowns, or insurance-related items may be part of the transaction even when the list price appears competitive.

For anyone comparing Cape Coral and Fort Myers, the best choice depends on lifestyle as much as price. Cape Coral offers an extensive canal network, newer construction in many areas, and a suburban layout. Fort Myers provides a broader mix of established neighborhoods, condos, historic areas, riverfront locations, and access to major employment and cultural destinations.

What buyers should do in today’s market

The current market rewards preparation rather than urgency.

Before touring homes, buyers should:

  • Obtain a current preapproval based on a realistic monthly budget
  • Account for property taxes, homeowners insurance, flood insurance, HOA fees, and maintenance
  • Compare recent closed sales: not just active listings
  • Review the property’s insurance history when available
  • Schedule thorough inspections
  • Research rental restrictions before purchasing an investment property
  • Separate cosmetic concerns from major structural or mechanical issues

In Cape Coral, buyers interested in SWFL waterfront homes should also request information about seawalls, docks, lifts, canal access, and permits early in the process. A lower purchase price may not represent a bargain if major waterfront repairs are approaching.

You can search available Southwest Florida properties across Cape Coral, Fort Myers, Sanibel, Fort Myers Beach, and surrounding communities.

What sellers should do before listing

Sellers should begin with a property-specific pricing analysis rather than relying on a citywide median or an online estimate.

A strong listing strategy may include:

  • Reviewing the most recent comparable sales
  • Pricing against current competition, not past peak prices
  • Completing high-impact repairs and cosmetic updates
  • Improving exterior presentation and photography
  • Preparing documentation for permits, roof work, seawalls, and renovations
  • Clearly explaining waterfront access and boating characteristics
  • Building a marketing plan for both local and out-of-state buyers

The right price is designed to create activity early. A listing that starts too high may accumulate days on market, require multiple reductions, and eventually appear less attractive than a newer competing property.

Why working with local Cape Coral real estate agents matters

Hyper-local knowledge is especially valuable in a market where two nearby homes can perform very differently. Experienced cape coral real estate agents and realtors cape coral should be able to explain differences between neighborhoods, canal systems, insurance considerations, flood zones, construction types, and buyer demand.

RE/MAX Realty Team serves Cape Coral, Fort Myers, Sanibel, Fort Myers Beach, and neighboring Southwest Florida communities. With more than 100 full-time real estate professionals and offices serving the region, the team provides guidance for buyers, sellers, renters, second-home owners, and investors.

RE/MAX Realty Team office serving Southwest Florida real estate clients

Meet the RE/MAX Realty Team or contact the office to discuss your goals and receive advice based on your specific property, neighborhood, and timeline.

The takeaway

Cape Coral and Fort Myers are not experiencing a single, uniform market in 2026. Overall conditions are closer to balanced, but buyers may find stronger negotiating power in condos, higher-priced homes, and some waterfront segments. At the same time, well-priced, move-in-ready homes can still attract attention and sell more quickly.

The most important insight is simple: the citywide median is only the starting point. Your best strategy depends on the neighborhood, property type, condition, insurance profile, waterfront access, and intended use.

For a specific buying, selling, or investment decision, use current comparable sales and guidance from a local professional: not a broad market headline alone.

Market data cited in this article comes from Realtor.com’s August 2026 market pages and Florida Gulf Coast MLS data reported in the April 2026 Cape Coral single-family and condo update. Statistics can vary by source, date range, and property type.

Read More
3aEA0IQ8NNF
Uncategorized
September 3, 2026by Penny

Hyper-local Cape Coral & Fort Myers Real Estate Insights

Early-September 2026 edition | Prepared for September 3 publication

The post-Labor Day market is beginning with an important distinction: Cape Coral and Fort Myers are no longer moving in the same direction.

Cape Coral is showing a roughly balanced market with stable pricing and slightly stronger seller leverage. Fort Myers is leaning toward buyers, with lower prices, longer contract timelines, and more room to negotiate. At the same time, Lee County’s overall inventory is tightening, which means buyers may have fewer choices as the fall season develops.

That combination creates a market where broad headlines can be misleading. The city, neighborhood, property type, insurance profile, and asking price all matter.

The September 1 market pulse

The newest licensed MLS snapshot, refreshed September 1, 2026, shows the following:

Metric Cape Coral Fort Myers
Median sale price Approximately $375,000 Approximately $348,000
Year-over-year change Up approximately 0.3% Down approximately 6.0%
Sold price per square foot Approximately $220 Approximately $203
Sellers’ share of original asking price Approximately 94.2% Approximately 91.4%
Median days to contract Approximately 52 days Approximately 65 days
Market read Balanced, 56/100 Buyer-leaning, 40/100
Buyer versus seller leverage 44 / 56 60 / 40

These momentum-style scores are directional tools rather than official market indexes. Still, they capture the central difference: Cape Coral is holding its ground, while Fort Myers is giving buyers more negotiating power.

At the county level, approximately 11,185 homes are currently for sale, down about 6.6% month over month. Roughly 22% of county listings have experienced price cuts, suggesting that sellers remain responsive to buyer feedback even as inventory contracts.

The market is not returning to the conditions of the pandemic-era boom. But as fall begins, a well-priced home may receive more attention simply because buyers have fewer comparable choices than they did earlier in the year.

Cape Coral: balanced, but not uniform

Cape Coral canal homes and waterfront property in bright early-fall sunlight

Cape Coral’s median sale price of approximately $375,000 is nearly unchanged from a year ago. That stability is notable in a market where buyers remain selective and insurance, flood exposure, and maintenance costs continue to influence affordability.

Homes are selling for about $220 per square foot, and sellers are capturing approximately 94.2% of their original asking price. The median time to contract is about 52 days, faster than the countywide figure of approximately 60 days.

Cape Coral also has two important sources of competition:

  • New construction accounts for approximately 24% of recent sales.
  • Cash buyers represent approximately 28% of sales.

For resale sellers, that means condition and pricing must be evaluated against both existing homes and builder inventory. A resale home with a newer roof, pool, storm protection, mature landscaping, or completed upgrades may compare favorably with new construction. A dated property may need a sharper price or stronger concessions to compete.

Inventory has tightened over the tracked period, but the market remains segmented. Waterfront access, construction age, lot size, and neighborhood reputation can create major differences within the same ZIP code.

Cape Coral neighborhood signals

Recent neighborhood-level figures show a wide range of movement:

  • Rose Garden: Approximately $850,000, up about 39% year over year, with homes selling fastest at roughly nine days.
  • Yacht Club: Approximately $617,000, up about 14%.
  • Cape Harbour: Approximately $512,000, down about 20%.
  • Palaco Grande: Up approximately 22%.
  • Tarpon Landings: Down approximately 24%.

These numbers should not be read as a ranking of neighborhoods. They reflect different property mixes, waterfront characteristics, and relatively small sale counts. Still, they show why Cape Coral requires a property-specific analysis. A canal home in Rose Garden does not compete directly with a newer inland home in another part of the city.

For buyers, Cape Coral offers a balanced environment: enough leverage to negotiate thoughtfully, but not necessarily enough to wait indefinitely on a well-priced waterfront or move-in-ready home.

For sellers, the message is equally direct: stability does not excuse overpricing. Correctly positioned homes can move, while homes that ignore recent comparable sales may sit through the fall.

Fort Myers: the buyer opportunity is clearer

Established Fort Myers residential neighborhood with mature tropical trees and well-kept homes

Fort Myers is presenting a different set of conditions. The median sale price is approximately $348,000, down about 6.0% year over year. Sold price per square foot is approximately $203, and sellers are capturing about 91.4% of their original asking price.

That means buyers are negotiating roughly 9% below the original ask, although the final result varies significantly by property and price history.

The median time to contract is approximately 65 days, longer than in Cape Coral. The momentum-style market read is about 40/100, with buyer leverage at 60 and seller leverage at 40.

Fort Myers also has a much higher cash-buyer share: approximately 52% of recent sales. Cash competition can be meaningful in desirable neighborhoods, even while the broader market remains buyer-leaning. New construction represents only about 4% of recent sales, so Fort Myers buyers are more often comparing established homes, condos, townhomes, and older neighborhoods rather than competing directly with a large builder pipeline.

Fort Myers neighborhood signals

The citywide numbers do not tell the whole story:

  • Heritage Palms Estates: Approximately $856,000, with homes selling in about five days.
  • Whiskey Creek: Approximately $514,000, with homes selling in about six days.
  • Briarcliff: Approximately $810,000, with homes selling in about seven days.
  • Island Park Village: Median pricing down approximately 47% year over year, but based on a thin sample.

The lesson is that Fort Myers can be both buyer-friendly and highly competitive: depending on the neighborhood. A well-maintained home in a sought-after established community may attract immediate interest, while an overpriced condo or property with high carrying costs may provide considerably more negotiating room.

What the countywide context means for fall

Lee County continues to attract new residents. The local migration measure used in this market report points to approximately 4,899 net new residents per year, with New York, Illinois, New Jersey, and Ohio among the leading inbound states.

The county’s Zillow home value is approximately $337,352, down about 5.4% year over year. That broader measure supports the idea that buyers are still finding more accessible prices than during the peak years, even though individual neighborhoods may be appreciating.

Insurance remains part of the calculation. Lee County homeowners face an average annual premium of approximately $2,197, while Citizens Property Insurance has roughly 6,508 policies in force in the county. Citizens’ first average rate decrease since 2015 took effect July 1, 2026, at approximately 8.7%, providing some relief: but insurance should still be treated as a major budget item.

A buyer should obtain property-specific homeowners, wind, and flood insurance estimates before becoming too committed to a purchase. Older roofs, waterfront exposure, elevation, prior storm damage, and mitigation features can materially change the cost.

For additional statewide context, buyers and sellers can review Florida Realtors market reports, Citizens Property Insurance resources, and Lee County population data through FRED.

Southwest Florida home-buying due diligence with keys, inspection materials, and insurance documents

A fall strategy for each type of client

For buyers

Cape Coral buyers should be prepared to move decisively when a property is correctly priced, especially in desirable waterfront neighborhoods and homes with strong insurance profiles.

Fort Myers buyers may have more room to negotiate on price, repairs, credits, and closing terms. Pay close attention to the property’s previous price reductions and total time on market.

In either city:

  • Compare recent closed sales, not only active listings.
  • Request insurance estimates early.
  • Include taxes, flood coverage, HOA fees, maintenance, and utilities in your monthly budget.
  • Review roof age, permits, storm repairs, seawalls, and association documents.
  • Do not assume that a lower asking price equals a lower cost of ownership.

For sellers

The post-Labor Day season can bring renewed buyer activity, but buyers are better informed and have alternatives.

Cape Coral sellers should price against comparable waterfront, new-construction, and resale properties: not against the citywide median. Fort Myers sellers should be prepared for more negotiation, particularly if the property is dated, attached, or burdened by high association or insurance costs.

Strong presentation still matters, but accurate pricing is the first step. Gather roof records, permits, insurance information, and repair documentation before listing.

For investors

Cape Coral’s stable pricing and new-construction activity may offer opportunities, but investors must account for competition from builders and realistic rental demand.

Fort Myers’ softer pricing may create attractive entry points, especially for buyers who can improve an established property. However, higher cash-buyer activity and neighborhood-specific demand mean that the best deals may move quickly.

Every investment analysis should include:

  • Conservative rent projections
  • Vacancy and turnover
  • Insurance and flood coverage
  • Property management
  • Repairs and capital reserves
  • HOA fees or special assessments
  • Taxes and financing costs
  • Local rental restrictions

Summary and takeaway

The early-September 2026 market is defined by divergence.

Cape Coral is approximately balanced: prices are stable, homes are reaching contract faster, inventory has tightened, and sellers retain slightly more leverage. Fort Myers is buyer-leaning: prices are down year over year, homes take longer to contract, and buyers are negotiating more substantially below original asking prices.

The broader Lee County market is still adjusting, but shrinking inventory could make the fall season more competitive for desirable homes. Insurance, flood exposure, construction type, and neighborhood-level demand remain just as important as the headline median.

Whether you are buying, selling, or investing, the best decision will come from comparing the specific property: not relying on a single citywide statistic.

Neighborhood-level medians can move sharply when only a small number of homes sell. The neighborhood figures above are directional, not verdicts, and data may vary by source, reporting period, property type, and geographic boundaries.

Explore available Southwest Florida properties, learn more about RE/MAX Realty Team, or contact our office for local guidance throughout Cape Coral, Fort Myers, Sanibel, Fort Myers Beach, and surrounding communities.

Sources

  • Licensed MLS market snapshot refreshed September 1, 2026; Cape Coral and Fort Myers figures are approximate and subject to ongoing updates.
  • Florida Realtors Market Reports
  • FRED: Lee County, Florida Population
  • FRED: Cape Coral–Fort Myers Active Listing Data
  • Citizens Property Insurance Corporation
  • RE/MAX Realty Team Southwest Florida
  • Search Southwest Florida Properties

This article is for general informational purposes only and is not an appraisal, insurance quote, lending decision, or substitute for individualized real estate, legal, tax, insurance, or financial advice. Market data can vary by source, geography, property type, and reporting methodology.

Read More
wonW9aTh5ka
Uncategorized
September 2, 2026by Penny

Hyper-local Cape Coral & Fort Myers Real Estate Insights

As Southwest Florida enters September 2026, the Cape Coral and Fort Myers real estate markets are showing a more balanced pattern than the headlines often suggest. Buyers have more time and negotiating room than they did during the pandemic-era boom, but inventory has tightened meaningfully from its earlier 2026 highs. At the same time, well-priced single-family homes: especially those with desirable locations, modern updates, or waterfront access: continue to attract steady attention.

This market is not moving in one direction. Conditions vary by city, neighborhood, property type, canal access, insurance profile, and price point. Here is the latest hyper-local snapshot for buyers, sellers, and investors in Lee County.

Data note: The most recent city-level figures available for this update reflect August 2026 conditions. Metrics can vary by source, property type, and geographic boundaries. Always review current MLS data and property-specific information before making a real estate decision.

Cape Coral market update 2026: More balanced, but still price-sensitive

Cape Coral’s market has continued to normalize throughout 2026. According to Realtor.com’s August 2026 Cape Coral market summary, the city had approximately:

  • 5,910 active homes for sale
  • $414,173 median listing price
  • $383,000 median sold price
  • 85 median days on market
  • 97% median sale-to-list ratio
  • $1,950 median monthly rent

The median listing price was down approximately 6.89% year over year, while active listings were down nearly 15%. That combination tells an important story: buyers are still benefiting from more realistic pricing, but the number of available homes is no longer expanding at the same pace seen earlier in the year.

Cape Coral is currently best described as a balanced market with room for negotiation. Homes that are overpriced, dated, or difficult to insure may remain available for several months. Conversely, properties that are clean, appropriately priced, and located in popular areas can move considerably faster than the citywide median suggests.

Hyper-local Cape Coral differences

Cape Coral is a large and diverse market, so citywide averages only provide a starting point. Recent Realtor.com neighborhood data show notable differences:

  • Mariner: Approximately $369,000 median listing price
  • Diplomat: Approximately $339,900
  • Caloosahatchee: Approximately $399,900
  • Pelican: Approximately $534,950
  • Cape Harbour: Approximately $509,225
  • Cape Royal Country Club Estates: Approximately $774,500

ZIP codes tell a similar story. The median listing price was approximately $342,500 in 33909, compared with about $539,000 in 33914. Those differences reflect more than geography; they can also reflect canal access, lot size, construction age, amenities, and proximity to the river or Gulf.

This is why working with experienced Cape Coral real estate agents matters. A citywide median cannot tell you whether a particular home is correctly priced for its canal type, flood zone, seawall, neighborhood, or condition.

SWFL waterfront homes remain highly desirable: but due diligence is essential

Waterfront property continues to define much of Cape Coral’s appeal. However, buyers in 2026 are evaluating waterfront homes more carefully than they did several years ago. The view and dock still matter, but so do the cost and practicality of owning the property.

Recent local market analysis places Cape Coral waterfront properties in several broad pricing tiers:

  • Off-water single-family homes: Around the mid-$300,000s in many areas
  • Freshwater canal homes: Often in the $400,000s
  • Gulf-access homes with bridges: Frequently in the $600,000 range
  • Direct Gulf-access homes without bridges: Commonly higher, with luxury examples reaching well above $1 million

These figures are broad market indicators, not appraisals. A home’s value can change significantly based on boating route, bridge clearance, water depth, seawall condition, dock improvements, pool, updates, and storm-related repairs.

Waterfront homes and boats along a Cape Coral canal at sunset

What waterfront buyers should verify

Before making an offer on a canal home, buyers should investigate:

  1. The actual boating route
    “Gulf access” can mean very different things. Check bridge heights, canal connections, estimated travel time, and whether the route fits your boat.

  2. Flood zone and elevation information
    Confirm the property’s FEMA flood zone and ask whether an elevation certificate is available. Financing requirements and insurance costs can vary substantially.

  3. Flood and homeowners insurance quotes
    Obtain quotes during the inspection or due-diligence period. Insurance should be part of the affordability calculation: not an afterthought.

  4. Seawall, dock, and lift condition
    A seawall inspection by a qualified marine contractor can help identify cracking, bowing, erosion, or other potential expenses.

  5. Post-storm documentation
    Review permits, repair invoices, roof records, and any available insurance or restoration documentation.

In the current market, a well-maintained seawall and functional dock can support value. Older infrastructure, uncertain permits, or unusually high insurance costs can become meaningful negotiation points.

Fort Myers real estate trends: A clear split between property types

Fort Myers presents a different market profile from Cape Coral. According to Realtor.com’s August 2026 Fort Myers market data, the city had approximately:

  • 3,977 active homes for sale
  • $329,000 median listing price
  • $325,000 median sold price
  • 93 median days on market
  • 95% median sale-to-list ratio
  • $2,000 median monthly rent

The median listing price was down approximately 6.78% year over year, and active listings were down about 17.14%. Homes were selling for an average of roughly 4.51% below asking price, indicating somewhat more negotiating room than in Cape Coral.

The most important Fort Myers trend is the difference between single-family homes and attached properties. Updated single-family homes in desirable locations can attract strong demand, while many condos and attached homes remain more buyer-friendly because of longer marketing times, association costs, reserves, and insurance considerations.

Neighborhood pricing varies considerably:

  • Downtown Fort Myers: Approximately $395,750 median listing price
  • East 1st Street: Approximately $414,000
  • East Fort Myers: Approximately $264,450
  • Verandah: Approximately $402,454
  • Miromar Lakes: Approximately $1.39 million
  • 33919: Approximately $245,250 median listing price
  • 33913: Approximately $475,000

For buyers, this creates opportunities across a wide range of budgets. For sellers, it reinforces the importance of comparing against genuinely similar homes rather than relying on broad city statistics.

What buyers should do in September 2026

Today’s market rewards preparation more than speed alone. Buyers should:

  • Get fully pre-approved before touring seriously.
  • Compare total monthly cost, including taxes, insurance, HOA fees, flood insurance, and maintenance.
  • Review comparable sales: not just current asking prices.
  • Pay close attention to days on market and previous price reductions.
  • Use inspection, financing, and insurance contingencies appropriately.
  • Be ready to act when a well-priced home appears, particularly in the single-family segment.

Cape Coral buyers may find more selection for waterfront and newer homes, while Fort Myers buyers may find value in condos, established neighborhoods, and properties needing cosmetic updates.

What sellers should do differently

The 2026 market is not hostile to sellers, but it is less forgiving of optimistic pricing. Sellers should focus on:

  • Pricing from recent comparable sales and current competition.
  • Addressing visible maintenance issues before listing.
  • Providing roof, permit, storm-repair, and insurance information early.
  • Presenting outdoor spaces, pools, docks, and waterfront frontage professionally.
  • Reviewing buyer feedback quickly after the first two to three weeks.
  • Staying flexible on repairs, credits, or closing terms when appropriate.

A home that is priced correctly from day one can stand out in a market where buyers have numerous alternatives. A home that starts too high may accumulate days on market and require larger reductions later.

Modern Southwest Florida home with a bright pool and outdoor living area

Investor considerations: Look beyond the purchase price

Investors should be especially careful when comparing Cape Coral and Fort Myers opportunities. Cape Coral’s median rent was approximately $1,950 in August, while Fort Myers’ median rent was about $2,000. Both markets showed softer rental pricing compared with the prior year, making realistic income projections essential.

Before purchasing an investment property, calculate:

  • Expected rent based on comparable active and leased properties
  • Vacancy and seasonal turnover
  • Property management fees
  • Insurance and flood insurance
  • HOA dues and special assessments
  • Maintenance, pool service, lawn care, and seawall reserves
  • Financing costs and expected tax obligations

A lower purchase price does not automatically create a better investment. In some cases, a property with newer construction, better insurance documentation, or lower ongoing maintenance may produce a more dependable long-term result.

Local guidance for your next move

Whether you are searching for a home, evaluating a canal property, preparing to sell, or reviewing an investment opportunity, local context matters. RE/MAX Realty Team serves Cape Coral, Fort Myers, Sanibel, Fort Myers Beach, and surrounding communities with more than 100 real estate professionals across two offices.

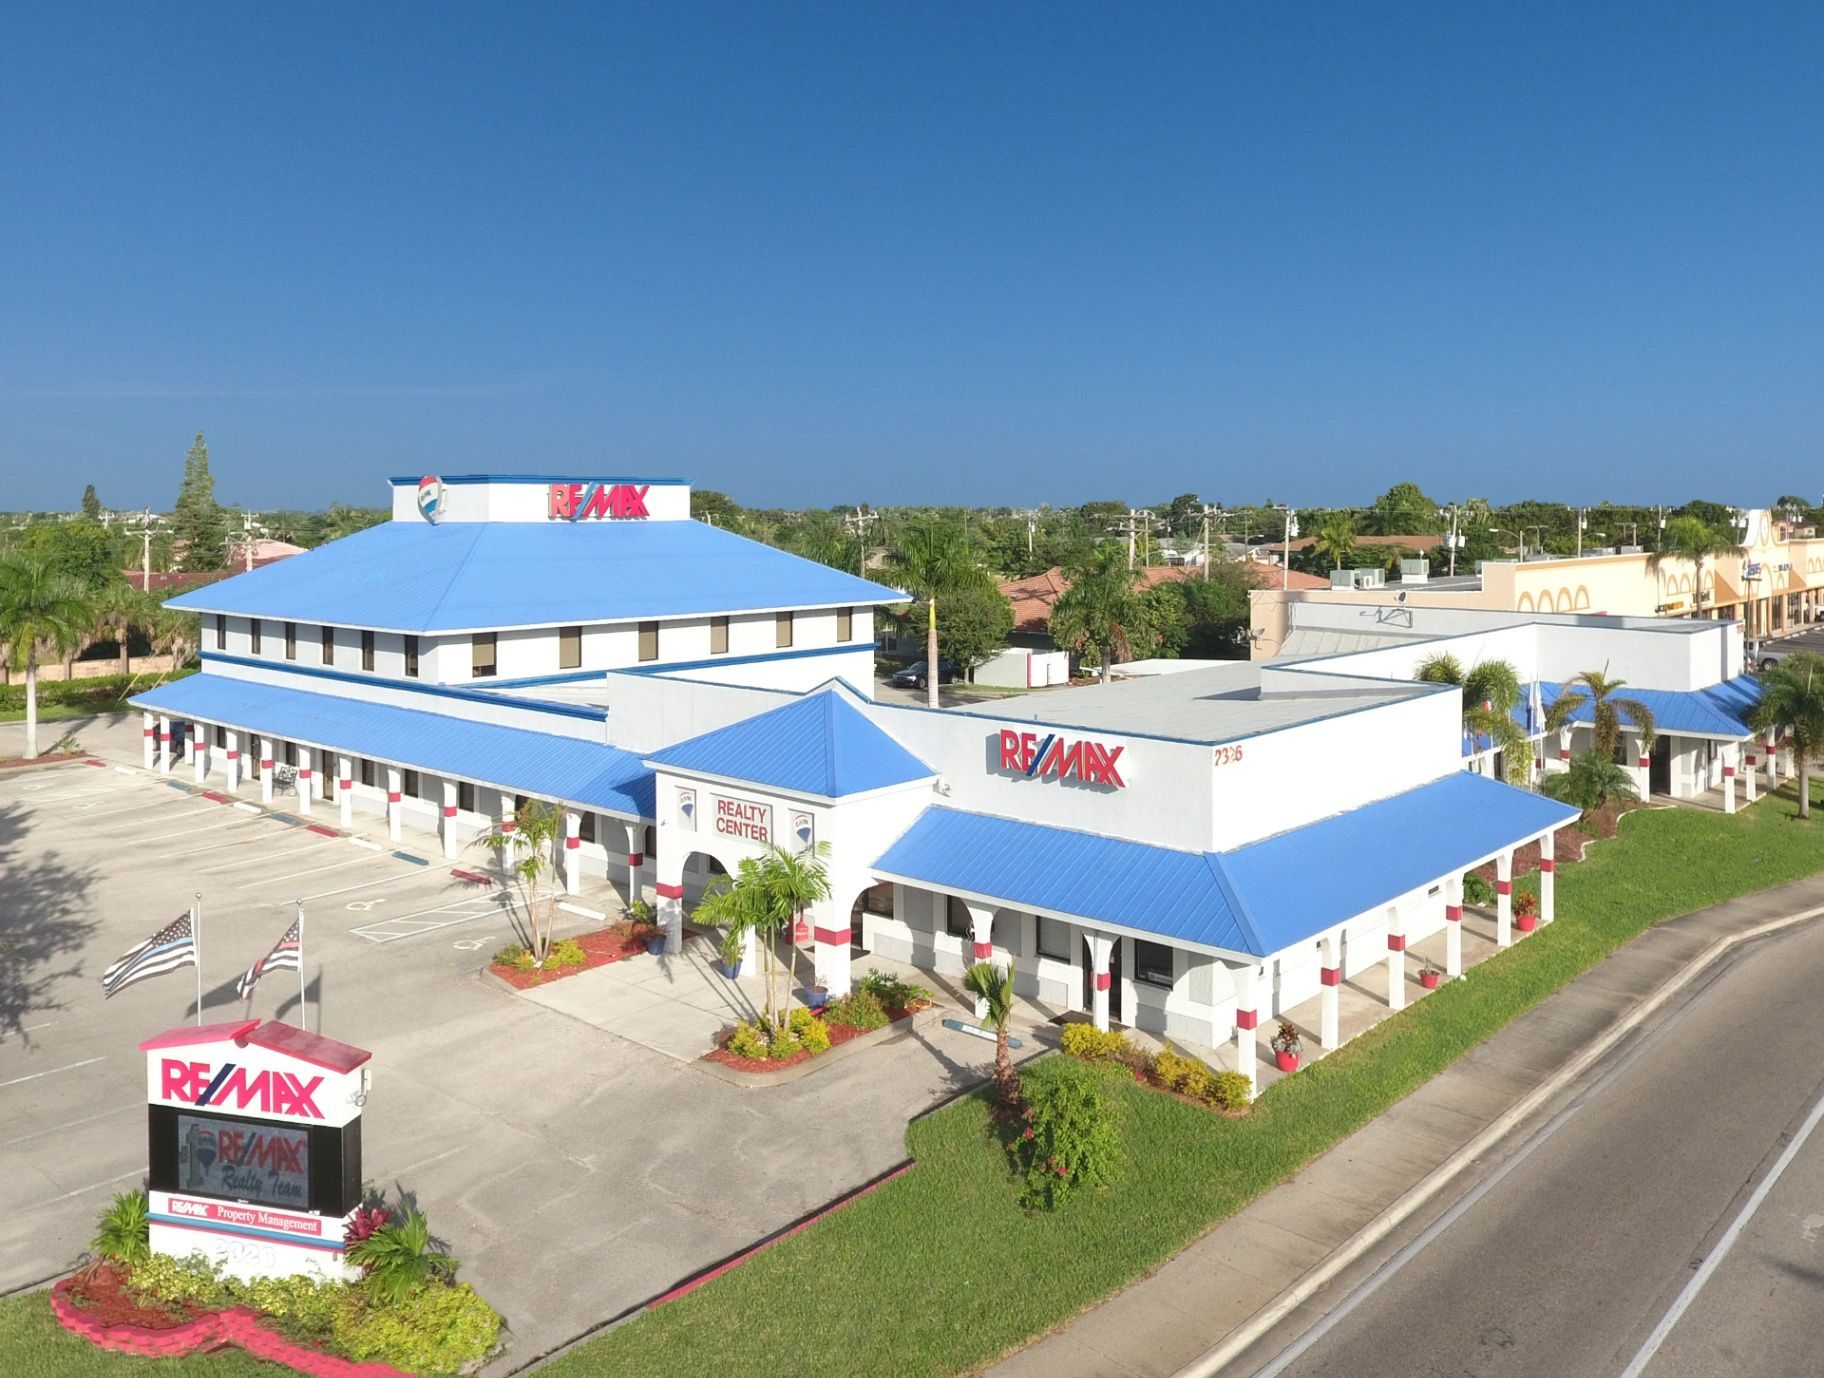
RE/MAX Realty Team office building serving Southwest Florida clients

You can search available Southwest Florida properties, learn more about the RE/MAX Realty Team, or contact the office to discuss your goals.

Summary and takeaway

The September 2026 Cape Coral and Fort Myers market is defined by balance and segmentation. Inventory has tightened from earlier highs, prices remain below recent peak levels in many areas, and buyers still have negotiating leverage: especially with condos, dated homes, and properties carrying significant insurance or infrastructure concerns.

At the same time, well-priced single-family homes and desirable SWFL waterfront homes continue to attract steady demand. The best strategy is not simply to buy or sell quickly. It is to understand the specific neighborhood, property type, insurance profile, and recent comparable sales before making a decision.

In Southwest Florida, the right opportunity is usually found through careful local analysis( not a single market statistic.)

Read More
lQH58gFo8OT
Uncategorized
August 31, 2026by Penny

Hyper-local Cape Coral & Fort Myers Real Estate Insights

Late-August 2026 market update | Latest complete monthly data: July 2026

As of August 30, 2026, July remains the latest complete month of published market data for Cape Coral and Fort Myers. The headline is straightforward: Southwest Florida real estate is active, but it is not one-size-fits-all.

Inventory has declined from last year, sales activity has improved, and buyers still have more time and negotiating leverage than they did during the pandemic-era boom. At the same time, desirable single-family homes, well-positioned waterfront properties, and certain Cape Coral neighborhoods can still attract strong attention.

The details matter. Here is what the latest data means for buyers, sellers, and investors.

The big-picture Southwest Florida snapshot

According to Realtor.com’s July 2026 Cape Coral–Fort Myers market report:

  • Median list price: $390,000, down 6.2% year over year
  • Median days on market: 94 days, down 7.4% year over year
  • Listings with price cuts: approximately 18.2%
  • Active listings: down about 20.4% year over year, compared with a 2.1% national increase

The combination is worth unpacking. Fewer active listings might suggest a more competitive market, but the 94-day median marketing period shows that buyers are still taking their time. Price reductions also remain common enough to create opportunities for well-prepared buyers.

In other words, the market is more balanced than it was several years ago: but “balanced” does not mean every home is negotiable to the same degree. Condition, location, insurance costs, flood exposure, property type, and pricing strategy all play a major role.

A second data set provides a slightly different perspective on Fort Myers. CoStar’s Homes.com data, reported by the Business Observer, shows that the Fort Myers MSA recorded:

  • 1,777 home sales in July
  • Sales up 14.5% from July 2025
  • Median sale price of $358,000, up 0.8% year over year
  • Homes selling for approximately 91.9% of list price
  • 11,547 homes for sale, nearly 950 fewer than in June and the lowest inventory level recorded in 2026

These figures point to an improving level of activity, but not runaway price growth. Buyers are purchasing homes, yet they are still negotiating below asking price in many situations.

Cape Coral: ZIP code matters

Cape Coral is one of the clearest examples of why citywide statistics can be misleading. A newer inland home in northeast Cape Coral, a pool home on a freshwater canal, and a Gulf-access property in southwest Cape Coral may all be counted in the same citywide report: but they appeal to different buyers and carry very different values.

ZIP code 33914: premium pricing and stronger competition

Southwest Cape Coral, including much of ZIP code 33914, remains one of the area’s higher-priced and more competitive segments.

Market snapshots place typical closed-sale prices near $500,000, with current list prices often in the mid-$500,000s or higher. Price per square foot is also among the highest in Cape Coral, reflecting established neighborhoods, larger homes, desirable locations, and a significant concentration of waterfront properties.

For buyers, the challenge is finding the right property before it attracts competing interest. For sellers, accurate pricing is still essential. A desirable location does not eliminate the need to justify the asking price through condition, updates, documentation, and presentation.

ZIP code 33904: established neighborhoods with more buyer leverage

Southeast Cape Coral, including ZIP code 33904, generally occupies an upper-midrange price position. Typical sale prices are roughly in the $400,000 to $417,000 range, depending on the property mix.

This segment has shown softer pricing and longer marketing times than 33914. Inventory has also increased compared with prior years, giving buyers more room to compare homes and negotiate repairs, credits, or price.

The strongest listings can still perform well, particularly when they offer a pool, quality updates, a good lot, or convenient access to Fort Myers. However, sellers should not assume that simply listing near a neighbor’s price will produce the same result.

ZIP code 33990: a mid-range, relatively balanced market

Central and eastern Cape Coral, including ZIP code 33990, generally sits near the upper-$300,000s, with market snapshots showing a typical sale price around $370,000.

Prices have softened modestly, while days on market have remained relatively stable. That combination suggests a more balanced segment: less competitive than 33914, but not as inventory-heavy as some northern areas.

For buyers, 33990 can offer a practical middle ground between price, convenience, and housing variety. For sellers, realistic pricing and good condition remain important because buyers have alternatives.

ZIP code 33909: affordability and more inventory

North Cape Coral, including ZIP code 33909, tends to offer some of the area’s most accessible pricing for typical single-family homes, with many current listings in the mid-$300,000s.

This ZIP code also has a substantial amount of inventory and new construction. Longer marketing times and a broader selection generally create more buyer leverage, especially when comparing resale homes with builder offerings.

One caution: ZIP-level median sale statistics can be distorted by property type and unusually low-priced sales. Buyers and sellers should compare similar single-family homes rather than relying on one median number.

Bright Southwest Florida residential neighborhood illustrating detached homes and condominium communities

Fort Myers: detached homes and condos are telling different stories

Fort Myers has a diverse housing mix that includes detached homes, townhomes, condominiums, historic neighborhoods, gated communities, and coastal properties. Because of that variety, the overall market number needs to be viewed alongside property-type data.

Overall Fort Myers absorption is roughly seven or more months of inventory, which is generally buyer-leaning. However, detached single-family homes are closer to balanced, with approximately 4.4 to 5.0 months of supply in recent analyses.

That distinction matters. A well-priced single-family home in a desirable neighborhood may face meaningful competition, while an attached property with higher fees or more complicated insurance considerations may take longer to sell.

Condo and townhome guidance

The Fort Myers condo and townhome market remains softer than the detached-home market. Recent estimates place condo supply near seven months in Fort Myers, with coastal condo submarkets such as Fort Myers Beach carrying substantially more inventory.

This creates opportunities for buyers, but purchasing a condo requires more than comparing the list price. Before making an offer, review:

  • Association budgets and reserve information
  • Recent meeting minutes
  • Current or pending special assessments
  • Master insurance coverage
  • Flood-zone requirements
  • Monthly association fees and planned increases
  • Rental, pet, and occupancy restrictions
  • Building maintenance and inspection records

For sellers, the association’s financial health can affect buyer confidence, financing, and marketability. Providing organized documentation early may help reduce uncertainty during the transaction.

For investors, a lower purchase price does not automatically mean a stronger return. Rental restrictions, management costs, insurance, taxes, vacancy, and maintenance should all be included in the analysis.

SWFL waterfront homes: access is part of the value

Waterfront property remains one of Southwest Florida’s most recognizable advantages, especially in Cape Coral. But “waterfront” describes many different experiences.

A buyer may be choosing among:

  • Freshwater canal homes
  • Indirect Gulf-access properties
  • Direct Gulf-access homes
  • Sailboat-access locations
  • Properties near fixed bridges
  • Wide canals and intersecting waterways
  • Riverfront or open-water homes

The value is not determined by the view alone. Buyers should investigate bridge clearance, canal depth, travel time to the Caloosahatchee River, seawall condition, dock and lift permits, flood exposure, and the type of boat they intend to use.

Cape Coral waterfront home with dock, boat, canal access, and tropical landscaping

A property that works well for kayaking may not meet the needs of a larger boat owner. Likewise, a canal that looks attractive in a listing photo may have limitations that become important during low tide or when navigating bridges.

Sellers should gather seawall records, permits, surveys, dock information, flood documentation, and insurance details before listing. Clear documentation can make due diligence easier and help buyers understand what they are purchasing.

Practical guidance for buyers, sellers, and investors

Buyers

Preparation is still one of your strongest advantages. Obtain current financing documentation, request insurance estimates early, and compare total monthly costs: not just the purchase price.

A strong offer does not always mean the highest offer. Clear terms, reasonable timelines, appropriate contingencies, and proof of funds can improve your position while protecting your interests.

Sellers

Price from current comparable sales, not from what a neighbor hopes to receive or what the market supported several years ago. Review similar properties by neighborhood, age, condition, lot, waterfront access, and property type.

Before listing, consider addressing visible maintenance issues, organizing roof and HVAC records, improving curb appeal, and preparing a clear plan for inspections and insurance questions.

Investors

Underwrite conservatively. Use realistic rent projections, include vacancy and maintenance reserves, verify rental restrictions, and account for property management and insurance. The best investment is not always the least expensive property: it is the one with the most reliable relationship between purchase price, operating costs, income, and long-term demand.

Summary and takeaway

The late-August 2026 Southwest Florida market is active, selective, and highly segmented.

Cape Coral–Fort Myers median list pricing is approximately $390,000, while Fort Myers recorded a $358,000 median sale price in July. Sales increased, but homes sold for about 91.9% of list price on average. Inventory has declined from last year, yet buyers still have more time and negotiating room than during the boom.

Cape Coral ZIP codes show meaningful differences: 33914 remains premium and competitive, 33904 is more negotiable, 33990 is relatively balanced, and 33909 offers more inventory and new-construction choices. In Fort Myers, detached homes are closer to balanced while condos and townhomes remain more buyer-leaning.

The most useful next step is a property-specific conversation. Explore available Southwest Florida properties, learn more about RE/MAX Realty Team, or contact our office for local guidance throughout Cape Coral, Fort Myers, Sanibel, Fort Myers Beach, and surrounding communities.

Sources

  • Realtor.com: Cape Coral–Fort Myers Real Estate Market, July 2026
  • Business Observer: Home Sales Rise While Inventory Drops
  • Homes.com: Fewer Homes Are for Sale in Fort Myers, but Buyers Remain in Control
  • Florida Realtors Market Reports
  • Florida Realtors July 2026 Cape Coral–Fort Myers MSA Summary
  • RE/MAX Realty Team

Market data can vary by source, geography, property type, and reporting methodology. This article is for general informational purposes and is not an appraisal, insurance quote, lending decision, or substitute for individualized real estate, legal, tax, or financial advice.

Read More
bPYrZVu0I9u
Uncategorized
August 27, 2026by Penny

Hyper-local Cape Coral & Fort Myers Real Estate Insights

As of August 26, 2026, the latest complete monthly data available for Southwest Florida is primarily from July 2026, supplemented by Realtor.com market indicators updated in August. The numbers point to a market with more negotiating room than during the pandemic-era boom: but one that is not behaving the same way in every neighborhood or property category.

For buyers, sellers, and investors, the most useful insight is not a single countywide median. It is understanding how Cape Coral, Fort Myers, condos, detached homes, waterfront properties, and specific ZIP codes are performing differently.

The Southwest Florida market at a glance

Realtor.com’s Lee County market snapshot, reflecting data through July 2026, reports:

  • Median listing price: $390,000
  • Median sold price: $350,000
  • Active listings: 21,322
  • Median days on market: 94 days
  • Median listing price per square foot: $235
  • Median rent: $2,000 per month

Compared with the prior year, active listings were down approximately 12%, while the median listing price was down about 4.9%. That combination suggests a market that has become more selective: there may be fewer homes than a year ago, but buyers are still carefully comparing condition, location, insurance costs, and total monthly payment.

Florida Realtors’ July 2026 Cape Coral–Fort Myers MSA summary provides additional context for existing single-family homes. The metro recorded approximately 1,331 closed single-family sales, up 13% year over year, with a median sale price of $385,000, up 2.7% from July 2025.

These figures describe a healthier level of activity, not a return to bidding-war conditions. Pricing power depends heavily on the property’s exact location and presentation.

RE/MAX agent discussing waterfront home options with buyers on a sunny Florida porch

Cape Coral market update 2026: a wide range of opportunities

Cape Coral remains one of the most segmented housing markets in Lee County. A newer inland home, a freshwater canal property, and a direct Gulf-access home may all be marketed as “Cape Coral real estate,” but they serve very different buyers and command different pricing.

Realtor.com’s August 2026 Cape Coral indicators show:

  • Median listing price: $414,173
  • Homes for sale: approximately 5,910
  • Median days on market: 85 days
  • Median rent: $1,950 per month

ZIP codes also reveal meaningful distinctions:

  • 33993: median listing price of approximately $399,702
  • 33909: approximately $342,500
  • 33914: approximately $539,000
  • 33972: approximately $359,000

These are listing medians, not appraisals or final sale prices. They reflect different mixes of home size, age, lot type, new construction, and waterfront exposure.

What this means for Cape Coral buyers

Buyers looking in the northeast and northwest portions of Cape Coral may find more choices at lower entry prices, particularly for inland homes and newer construction. In contrast, ZIP code 33914 includes many higher-priced homes, established neighborhoods, and waterfront locations, so its median is not directly comparable with 33909 or 33972.

A buyer comparing new construction with resale should calculate the full cost of ownership. Builder incentives may include closing-cost credits, rate buydowns, appliances, landscaping, or upgrades. A resale home may already include features such as window treatments, mature landscaping, pool equipment, storm protection, or a finished seawall.

The right comparison is not simply the list price. Review:

  • Total monthly payment
  • Property taxes and estimated homestead status
  • Homeowners, wind, and flood insurance
  • HOA or amenity fees
  • Pool and seawall maintenance
  • Builder incentives and upgrade costs
  • Inspection and repair requirements

Working with experienced realtors Cape Coral buyers can rely on is especially valuable when comparing properties that appear similar online but differ substantially in boating access, construction quality, or long-term expenses.

Fort Myers real estate trends: detached homes and attached properties diverge

Fort Myers has an even broader mix of housing than Cape Coral. The city includes historic properties near downtown, riverfront communities, suburban neighborhoods, condos, townhomes, gated developments, and homes along the McGregor corridor.

Realtor.com’s August 2026 Fort Myers indicators show:

  • Median listing price: $329,000
  • Homes for sale: approximately 3,977
  • Median days on market: 93 days
  • Median rent: $2,000 per month

The citywide figure should be interpreted carefully because it blends multiple property types. A downtown condo, an older single-family home near Page Park, and a newer detached home east of I-75 do not share the same buyer pool or pricing dynamics.

For example, Realtor.com reports median listing prices of approximately:

  • 33908: $369,450
  • 33905: $390,536
  • 33904: $400,000

These ZIP codes contain different combinations of homes, condos, river-adjacent properties, established neighborhoods, and newer development. Buyers should compare properties with similar construction dates, square footage, lot characteristics, flood exposure, and proximity to employment centers or beaches.

Practical guidance for Fort Myers sellers

The current Fort Myers real estate trends favor accurate pricing and strong preparation. A well-maintained home in a desirable location may attract attention quickly, while a property priced from outdated 2022 expectations can accumulate days on market and require later reductions.

Before listing, sellers should:

  1. Review closed sales: not only competing active listings.
  2. Separate detached-home comparables from condo and townhome sales.
  3. Gather roof, HVAC, storm-mitigation, and insurance documentation.
  4. Address visible maintenance issues.
  5. Present outdoor living areas as usable extensions of the home.
  6. Establish a plan for responding to inspection requests and insurance concerns.

Marketing matters, but pricing remains the first and most important decision.

Condos and townhomes offer a different opportunity

Florida Realtors reported that the Cape Coral–Fort Myers metro’s condo and townhouse market recorded a 26.9% year-over-year increase in second-quarter 2026 closed sales. The second-quarter median sale price for the segment was approximately $285,000.

That increased activity does not mean every condo is equally positioned. Buyers continue to evaluate association finances and building condition carefully, particularly after changes in insurance costs and greater attention to reserves and structural maintenance.

Condo buyers should request and review:

  • Association budgets and reserve information
  • Recent meeting minutes
  • Pending or completed assessments
  • Master insurance coverage
  • Flood-zone information
  • Rental and pet restrictions
  • Monthly fees and planned increases
  • Building maintenance schedules

For investors, a lower purchase price does not automatically create a better return. Rental restrictions, seasonal demand, property management, insurance, taxes, vacancy, and maintenance all influence net operating income.

SWFL waterfront homes: location is only the beginning

Demand for SWFL waterfront homes remains strong, but “waterfront” is not a single property category.

In Cape Coral, buyers may be comparing:

  • Freshwater canal homes
  • Indirect Gulf-access homes
  • Direct Gulf-access homes
  • Wide or intersecting canals
  • Homes with fixed-bridge limitations
  • Sailboat-access properties
  • Riverfront or open-water locations

The value of a waterfront property depends on more than the view. Buyers should investigate:

  • Travel time to the Caloosahatchee River or Gulf
  • Bridge height and clearance
  • Canal depth and width
  • Seawall age and condition
  • Dock, lift, and electrical permits
  • Tide and storm-surge exposure
  • Flood insurance requirements
  • Water access for the buyer’s specific boat

A kayaker, a fishing enthusiast, and a large-boat owner may assign very different values to the same canal. A knowledgeable local agent can help buyers distinguish between attractive water views and genuinely useful boating access.

Sellers should gather permits, seawall records, dock information, surveys, and insurance documents before listing. Waterfront buyers tend to perform detailed due diligence, and organized documentation can reduce uncertainty during negotiations.

Aerial view of Cape Coral canals lined with waterfront residences and docks

Guidance for buyers, sellers, and investors this month

Buyers

The late-summer market can reward preparation. Obtain updated financing documentation, request property-specific insurance quotes, and decide which features are essential before touring homes.

A strong offer does not always mean offering the highest price. Clean terms, realistic timelines, appropriate contingencies, and proof of funds can make an offer more attractive while still protecting the buyer.

Sellers

Do not rely on a countywide median or an online estimate to set a final price. The correct value depends on the neighborhood, property type, condition, improvements, lot, flood exposure, and recent comparable sales.

If you are planning a fall listing, use August to complete repairs, collect documentation, improve curb appeal, and develop a marketing strategy that highlights the features buyers in your segment actually value.

Investors

Underwrite conservatively. Use realistic rent assumptions, include vacancy and maintenance reserves, and confirm local rental rules before making an offer. Cape Coral single-family rentals, Fort Myers condos, seasonal properties, and long-term rentals each require a different investment analysis.

Summary and takeaway

The August 26, 2026 market is active but highly segmented. Lee County’s median sold price is approximately $350,000, while Florida Realtors reports a $385,000 median for July single-family sales in the Cape Coral–Fort Myers metro. Cape Coral’s median listing price is higher than Fort Myers’, but ZIP-code and property-type differences explain much of that gap.

Buyers have more time to compare homes and negotiate than they did during the boom, but desirable properties can still move quickly. Sellers need accurate pricing, strong preparation, and clear documentation. Investors should focus on net returns rather than purchase price alone. For waterfront homes, boating access, seawalls, bridges, insurance, and permits are central to value.

Explore available Southwest Florida properties, learn more about RE/MAX Realty Team, or contact our office for guidance from local Cape Coral real estate agents serving Cape Coral, Fort Myers, Sanibel, Fort Myers Beach, and surrounding communities.

Market data is subject to change and may vary by source, geography, property type, and reporting period. This article uses the latest available July 2026 and August 2026 market information identified above. It is for general informational purposes and is not an appraisal, insurance quote, lending decision, or substitute for individualized real estate, legal, tax, or financial advice.
Sources

  • Florida Realtors Florida Market Reports
  • Florida Realtors: Florida Condo Sales Grow at Both Ends of Market
  • Florida Realtors July 2026 Cape Coral–Fort Myers MSA Summary
  • Realtor.com Lee County Market Data
  • RE/MAX Realty Team Property Search
Read More
BAFap7boTnQ-740×480
Uncategorized
August 25, 2026by Penny

Hyper-local Cape Coral & Fort Myers Real Estate Insights

Monday, August 24, 2026

The final full week of August gives Southwest Florida buyers and sellers a useful moment to pause and read the market before Labor Day and the traditional fall real estate season.

The latest available July 2026 MLS data point to a market that is active, negotiable, and increasingly segmented. Lee County’s median sale price held steady at $350,000 year over year, but that headline number hides an important shift: new construction is now closing below resale homes at the countywide median.

For buyers, this creates a comparison opportunity that has not been common in recent years. For resale sellers, it raises the importance of condition, pricing, and preparation before listing this fall.

Real estate agent discussing Fort Myers market trends with buyers in a waterfront home

The July 2026 Lee County market at a glance

According to the July MLS snapshot, Lee County recorded several signals worth watching as we move toward September:

  • Median sale price: $350,000, unchanged from July 2025
  • New-construction median: $338,000
  • Resale median: $361,000
  • New-construction share of closings: 23%
  • New-construction closings: 404, up 42.8% year over year
  • Average sale-to-original-list-price ratio: 93.4%
  • Median time to contract: 63 days

The new-construction figure is the standout. Builders accounted for nearly one-quarter of Lee County’s July closings, and new homes closed at a median approximately $23,000 below resale properties.

That does not mean every new home is worth less than every resale home. New construction and resale homes often differ in location, size, lot, upgrades, community amenities, and closing incentives. However, the numbers do indicate that buyers should no longer assume a new home automatically comes with a higher price.

Builders may also be competing through incentives that are not fully visible in the sale price, including interest-rate buydowns, closing-cost credits, appliance packages, or design upgrades.

For a buyer comparing a new build with an existing home, the most important question is not simply, “Which one has the lower list price?” It is, “What is included in the total cost of ownership?”

Cape Coral: more sales, but buyers still have negotiating room

Cape Coral’s July median was near $349,900 to $350,000, depending on the segment and data cut being reviewed. The city also recorded 884 homes sold, compared with 799 during the same period last year.

That increase in volume suggests that buyers are still active, even with mortgage rates in the mid-6% range. It also shows that well-priced homes can attract attention in a reasonable timeframe.

At the same time, Cape Coral buyers are not necessarily expected to pay the asking price. The negotiation gap is around 15.3% below asking in the current market read. This is a reminder that list price and final sale price can be meaningfully different, particularly when a home needs repairs, has been sitting on the market, or competes directly with builder inventory.

Supply varies significantly by property type:

  • Cape Coral single-family homes: approximately 4.4 months of supply
  • Cape Coral condos: approximately 8.8 months of supply

Single-family homes remain closer to balanced-market conditions, while condos give buyers more choice and potentially more negotiating leverage. Condo buyers should also examine association budgets, reserves, insurance costs, assessments, rental rules, and building maintenance before making an offer.

For anyone searching for SWFL waterfront homes, Cape Coral requires an even more detailed comparison. Waterfront value is influenced by boating access, bridge clearance, seawall condition, dock improvements, canal width, exposure, and proximity to open water.

Aerial view of Cape Coral’s canal system and waterfront properties

Cape Coral waterfront pricing is a tiered market

“Waterfront” is not one single category in Cape Coral. July figures illustrate how much the type of access can affect value:

  • Off-water homes: approximately $340,500
  • Freshwater canal homes: approximately $465,000
  • Gulf-access homes with bridges: approximately $615,000
  • Direct Gulf-access homes: approximately $692,500

These figures are broad market indicators, not property valuations. A renovated freshwater canal home may sell for more than an outdated Gulf-access property, and a home with a newer seawall or superior boating access may command a significant premium.

Buyers should evaluate waterfront properties based on their actual plans. A buyer who wants kayaking or peaceful water views may value a freshwater canal differently from a boat owner seeking direct access to the Gulf. Working with experienced cape coral real estate agents can help identify which waterfront features are truly important: and which may not justify the additional price or maintenance cost.

Fort Myers: detached homes command a higher median

Fort Myers presents a different picture because the market includes a broad mix of condos, townhomes, historic properties, suburban neighborhoods, and newer detached homes.

For Fort Myers detached homes, the July median was approximately $429,500 to $445,000, with around 4.5 to 5 months of supply. The city’s narrowest ask-bid gap was approximately 5.3%, suggesting that properly priced detached homes are selling closer to their original asking prices than many other segments.

This does not eliminate negotiation. Instead, it highlights the value of accurate pricing. A home that is positioned well from the beginning may receive stronger activity, while an overpriced listing can still require a later reduction.

The current Fort Myers real estate trends also reinforce the importance of comparing similar properties. A detached home near the river, a condo near downtown, and a suburban home farther east may all fall under the Fort Myers label while attracting very different buyers.

Mortgage rates and insurance offer mixed signals

Freddie Mac’s 30-year fixed mortgage average was approximately 6.65% to 6.69% in mid-August. Rates remain high enough that monthly payment calculations continue to shape buyer decisions, but even small rate movements can affect affordability and purchasing power.

Buyers should compare the complete monthly payment, including:

  • Principal and interest
  • Property taxes
  • Homeowners insurance
  • Flood insurance, if applicable
  • Wind coverage
  • HOA or condo fees
  • Maintenance and utilities

There is also some positive insurance news. Citizens Property Insurance is reporting its first average rate decrease since 2015, with reductions of approximately 8.7% to 8.8% for multiperil policies and about 5.5% for wind-only policies. In addition, the Florida Insurance Guaranty Association is ending its 1% emergency assessment two years earlier than initially expected.

These changes may provide some household budget relief, but actual premiums vary by property age, roof condition, construction features, location, flood exposure, claims history, coverage limits, and insurer. Buyers should obtain a specific insurance quote during the due-diligence period rather than relying only on countywide averages.

What buyers can do before Labor Day

The late-August market may create a practical window for buyers who are prepared to act.

1. Compare new construction and resale on equal terms

Ask builders about incentives, estimated taxes, HOA fees, closing costs, included features, and the cost of upgrades. Then compare those figures with a resale home that may already include landscaping, window treatments, appliances, pool equipment, storm protection, or other improvements.

2. Look beyond the median

A median is useful for identifying direction, but it does not determine the value of a specific property. Review recent comparable sales by neighborhood, property type, age, lot, water access, and condition.

3. Use inspection and insurance information strategically

A property with older mechanical systems, roof concerns, seawall needs, or difficult insurance requirements may justify a different offer than a turnkey home.

4. Get ready before fall competition increases

Have financing documentation updated, understand your comfortable payment, and be ready to move when the right property appears. A strong offer is not always the highest offer, but it should be clear, realistic, and supported.

Seller checklist for a fall listing

If you are considering selling in September or October, use the next few weeks to prepare rather than waiting until the sign goes in the yard.

  • Review recent comparable sales, not just current active listings.
  • Schedule a pricing consultation based on your neighborhood and property segment.
  • Complete deferred maintenance, especially roof, HVAC, plumbing, electrical, and pool items.
  • Inspect waterfront components, including seawalls, docks, lifts, boat access, and permits.
  • Confirm insurance information and gather wind-mitigation or flood-related documents.
  • Declutter and depersonalize so buyers can focus on the home’s layout and features.
  • Refresh curb appeal, including landscaping, exterior lighting, entry areas, and pool surroundings.
  • Plan professional photography around the home’s best natural light and outdoor living spaces.
  • Prepare disclosures and improvement records before the listing goes live.
  • Decide your negotiation strategy in advance, including whether you may offer closing credits, repairs, or a rate-related concession.

In a market where new construction is competing aggressively on incentives, resale sellers need to present the strongest overall value: not simply choose the highest possible asking price.

Summary and takeaway

The Monday market read for August 24 is encouraging but measured. Lee County’s median remains stable at $350,000, sales volume is active, and the median time to contract is 63 days. Yet buyers still have leverage, reflected in the 93.4% average sale-to-original-list-price ratio and the meaningful gap between asking prices and final sales in several segments.

The most important late-summer signal is the new-construction versus resale dynamic. With new homes representing 23% of July closings and closing at a $338,000 median compared with $361,000 for resales, buyers should compare incentives and total ownership costs carefully. Sellers planning for the fall season should focus on preparation, accurate pricing, and a clear value proposition.

Whether you are buying a Cape Coral canal home, comparing Fort Myers neighborhoods, or preparing to sell before the fall market gains momentum, local guidance matters.

Explore available Southwest Florida properties, learn more about RE/MAX Realty Team, or contact our office to connect with a local professional serving Cape Coral, Fort Myers, Sanibel, Fort Myers Beach, and surrounding communities.

Market statistics are based on the latest available July 2026 MLS information and may be preliminary or subject to revision. Mortgage rates, insurance costs, and property values vary by borrower, property, location, and coverage. This article is for general informational purposes and is not an appraisal, lending determination, insurance quote, or specific real estate advice.

Data sources

  • Florida Realtors July 2026 MSA summary
  • Freddie Mac Primary Mortgage Market Survey
  • RE/MAX Realty Team
Read More
BAFap7boTnQ
Uncategorized
August 24, 2026by Penny

Hyper-local Cape Coral & Fort Myers Real Estate Insights

Monday, August 24, 2026

Southwest Florida’s housing market continues to move in several directions at once. Buyers have more leverage in some segments, sellers are still finding demand for well-priced homes, and new construction is reshaping the definition of “market value” across Lee County.

This update reviews the latest available late-August information, with July 2026 MLS data serving as the primary reference point. The most important theme is segmentation: Cape Coral, Fort Myers single-family homes, condos, waterfront properties, and coastal communities are each telling a different story.

Market snapshot: Lee County in July 2026

  • Lee County median sale price: Approximately $350,000, unchanged from July 2025.
  • New-construction median sale price: $338,000.
  • Resale median sale price: $361,000.
  • New construction’s share of closings: 23%, with 404 sales, up 42.8% year over year.
  • Average sale-to-original-list-price ratio: 93.4%, up from 91.7% last year.
  • Time to contract: Half of sales went under contract within 63 days.
  • Mortgage rates: The 30-year fixed benchmark remained in the mid-6% range during August, keeping buyers rate-sensitive.

The new-construction and resale numbers are the standout development. For the first time in this series, new homes closed below resales at the county level. Builder incentives, rate buydowns, included upgrades, and the availability of modern features are making new construction more competitive than its headline price may suggest.

For buyers, the lesson is to compare the total cost and value, not simply the list price. For sellers, it is a reminder that an older home must compete against builder incentives as well as other resale listings.

Cape Coral real estate: More sales, more negotiation

Cape Coral’s median sale price remained near $349,900 to $350,000, while Zillow’s recent data showed a deeper correction of roughly 6% year over year. At the same time, activity is improving: a recent 30-day period recorded 884 homes sold, compared with 799 during the same period a year earlier.

That combination: softer pricing but rising volume: suggests a market where buyers are becoming more active without returning to the intense competition seen earlier in the decade.

Cape Coral’s negotiation gap remains one of the widest in the region. Homes are selling, on average, about 15.3% below asking price in the referenced market measure. This does not mean every property requires a dramatic reduction. It does mean that pricing strategy, condition, location, and accurate comparable sales matter significantly.

Inventory also varies sharply by property type:

  • Cape Coral single-family homes: Approximately 4.4 months of supply.
  • Cape Coral condos: Approximately 8.8 months of supply.

Single-family homes are therefore much more balanced than condos. A well-maintained detached home with a pool, practical updates, and a desirable location can still attract attention quickly. Condo sellers face a more competitive environment, particularly when buyers are evaluating association fees, insurance costs, reserves, and potential assessments.

Fort Myers is really two markets

Fort Myers blended statistics can make the market appear softer than it is for detached homes. When condos and other property types are included, the median is near $330,000, with marketing times around 99 days.

Detached single-family homes tell a different story:

  • Median prices are approximately $429,500 to $445,000, depending on the specific data set and area.
  • Supply is closer to 4.5 to 5 months.
  • Well-priced homes are often selling in approximately 45 to 50 days, near asking price.
  • The ask-bid gap is the narrowest in the region at approximately 5.3%.

This split is important for both buyers and sellers. A buyer searching for a Fort Myers single-family home may encounter more competition than the citywide median suggests. A buyer considering a condo may have more time and negotiating leverage, but should perform deeper due diligence before committing.

For sellers, using a blended Fort Myers median to price a detached home can be misleading. The right comparison should account for property type, neighborhood, age, flood exposure, renovations, community fees, and whether the home is waterfront.

Waterfront and coastal markets

Cape Coral waterfront property remains highly segmented. Recent median figures illustrate the price ladder:

  • Off-water homes: Approximately $340,500
  • Freshwater canal homes: Approximately $465,000
  • Gulf-access homes with bridges: Approximately $615,000
  • Direct Gulf-access homes: Approximately $692,500

These are not interchangeable categories. A freshwater canal may provide views and boating enjoyment but does not offer the same navigation options as a Gulf-access canal. Bridge clearance, lock systems, canal depth, seawall condition, dock improvements, boat lifts, and travel time to open water can all affect value.

Cape Coral waterfront home with private dock and canal access

In Sanibel and Fort Myers Beach, the market remains slower-moving and particularly property-specific. Buyers are carefully weighing storm history, elevation, reconstruction quality, insurance availability, rental rules, and the condition of shared buildings or infrastructure. Sellers in these coastal markets may need to allow more time and provide unusually complete documentation.

Insurance conditions are improving: but quotes still matter

There is some welcome movement on the insurance front. Citizens Property Insurance approved its first average rate decrease since 2015, with an estimated reduction of approximately 8.7% to 8.8% for multiperil homeowners policies, effective July 1, 2026. Wind-only policies were expected to see an average reduction of about 5.5%.

In addition, FIGA voted in February 2026 to end its 1% emergency assessment two years earlier than planned, representing approximately $650 million in savings for Florida policyholders.

These changes may improve affordability, but they should not be treated as a guaranteed quote for a specific property. Premiums can vary significantly by:

  • Coastal ZIP code
  • Roof age and construction
  • Wind-mitigation features
  • Flood zone and elevation
  • Prior claims
  • Replacement-cost estimates
  • Property type and occupancy

Before removing an insurance contingency or finalizing a purchase, buyers should obtain actual quotes from qualified insurance professionals. Coastal properties can still carry high premiums even when statewide averages improve.

Mortgage rates are another important part of the equation. Freddie Mac’s 30-year fixed benchmark was approximately 6.65% to 6.69% during August. At these levels, a modest price difference, seller credit, or lender rate buydown can materially change a buyer’s monthly payment.

The condo reserve-study era is changing values

Florida’s post-Surfside structural integrity requirements continue to reshape condo ownership and pricing. Buyers should expect greater scrutiny of older buildings, especially three-story: or taller: structures subject to milestone inspections and Structural Integrity Reserve Studies.

Older, under-reserved buildings are increasingly trading at estimated discounts of 15% to 20%, although the actual adjustment depends on the building’s condition and financial situation. A lower purchase price may be appropriate, but it does not automatically make the property a good investment.

Before purchasing a condo, review:

  • The latest milestone inspection
  • The Structural Integrity Reserve Study
  • Current reserve balances
  • Board meeting minutes
  • Pending or approved special assessments
  • Master insurance coverage
  • Engineering reports
  • Association budgets and fee history
  • Any planned repairs or financing arrangements

Well-maintained Southwest Florida condominium building with balconies and palms

A condo with higher monthly fees but strong reserves and completed repairs may offer more predictable ownership costs than a seemingly inexpensive unit in a building facing major future assessments.

Practical guidance for buyers, sellers, and investors

If you are buying

Compare new construction and resale homes side by side. Ask builders about incentives, closing-cost contributions, upgrade packages, HOA fees, CDD charges, and expected insurance costs. For resales, pay close attention to roof age, flood exposure, maintenance records, and the seller’s pricing history.

In Cape Coral, determine whether waterfront access matches your intended use. In Fort Myers, separate single-family comparisons from condo comparisons. If purchasing a condo, make document review a central part of the offer and due-diligence process.

If you are selling

The market is rewarding accurate pricing more than optimistic pricing. Review recent closed sales: not just active listings: and account for the competition from new construction. A home that is clean, well-presented, insurable, and priced close to its true market position has a better chance of attracting serious buyers.

Waterfront sellers should highlight the features that create measurable value, such as direct Gulf access, bridge clearance, seawall updates, dock improvements, and boating distance.

If you are investing

Look beyond the purchase price. Underwrite insurance, taxes, HOA or condo fees, maintenance, vacancy, financing, and potential assessments. Rising sales volume in Cape Coral may create opportunities, but a broad citywide number is not enough to evaluate a specific rental or investment property.

The takeaway

Lee County’s July 2026 market is balanced, but it is not uniform. New construction has moved from a premium alternative to a serious competitor, closing at a lower median than resales for the first time in this series. Cape Coral is seeing stronger transaction volume despite price corrections, while Fort Myers detached homes remain tighter than blended citywide figures suggest. Waterfront value depends heavily on access, and condo affordability increasingly depends on reserves, inspections, and future assessments.

Whether you are comparing Cape Coral real estate agents, researching realtors in Cape Coral, tracking Fort Myers real estate trends, or evaluating SWFL waterfront homes, local property-level analysis matters.

RE/MAX Realty Team has been the region’s #1 producing brokerage for more than 14 years, with offices in Cape Coral and Fort Myers and more than 100 agents serving Southwest Florida. Search available properties, learn more about our team, or contact our office for guidance tailored to your goals.

Market statistics are deemed reliable but are not guaranteed and may vary by source, timeframe, property type, and methodology. Insurance and mortgage information is subject to individual qualification, carrier guidelines, and market conditions.

Read More
  • 1
  • 2
  • 3
  • 4
  • 5
  • 6

Exceptional Service. Local Expertise. Proven Results.

(239) 242-2000

Cape Coral Office
2326 Del Prado Blvd. S.
Cape Coral, FL 33990


Fort Myers Office
6611 Orion Dr. #104
Fort Myers, FL 33912

Quick Links

  • Company
  • Search Online
  • Sell With RE/MAX
  • Contact Our Office

Join Our Team

Build your real estate career with a collaborative, experienced team committed to helping agents grow, succeed, and reach their full potential.

© 2026 RE/MAX Realty Team. All Rights Reserved | Website By: OMG