Uncategorized
Early-September 2026 edition | Prepared for September 3 publication
The post-Labor Day market is beginning with an important distinction: Cape Coral and Fort Myers are no longer moving in the same direction.
Cape Coral is showing a roughly balanced market with stable pricing and slightly stronger seller leverage. Fort Myers is leaning toward buyers, with lower prices, longer contract timelines, and more room to negotiate. At the same time, Lee County’s overall inventory is tightening, which means buyers may have fewer choices as the fall season develops.
That combination creates a market where broad headlines can be misleading. The city, neighborhood, property type, insurance profile, and asking price all matter.
The September 1 market pulse
The newest licensed MLS snapshot, refreshed September 1, 2026, shows the following:
| Metric | Cape Coral | Fort Myers |
|---|---|---|
| Median sale price | Approximately $375,000 | Approximately $348,000 |
| Year-over-year change | Up approximately 0.3% | Down approximately 6.0% |
| Sold price per square foot | Approximately $220 | Approximately $203 |
| Sellers’ share of original asking price | Approximately 94.2% | Approximately 91.4% |
| Median days to contract | Approximately 52 days | Approximately 65 days |
| Market read | Balanced, 56/100 | Buyer-leaning, 40/100 |
| Buyer versus seller leverage | 44 / 56 | 60 / 40 |
These momentum-style scores are directional tools rather than official market indexes. Still, they capture the central difference: Cape Coral is holding its ground, while Fort Myers is giving buyers more negotiating power.
At the county level, approximately 11,185 homes are currently for sale, down about 6.6% month over month. Roughly 22% of county listings have experienced price cuts, suggesting that sellers remain responsive to buyer feedback even as inventory contracts.
The market is not returning to the conditions of the pandemic-era boom. But as fall begins, a well-priced home may receive more attention simply because buyers have fewer comparable choices than they did earlier in the year.
Cape Coral: balanced, but not uniform

Cape Coral’s median sale price of approximately $375,000 is nearly unchanged from a year ago. That stability is notable in a market where buyers remain selective and insurance, flood exposure, and maintenance costs continue to influence affordability.
Homes are selling for about $220 per square foot, and sellers are capturing approximately 94.2% of their original asking price. The median time to contract is about 52 days, faster than the countywide figure of approximately 60 days.
Cape Coral also has two important sources of competition:
- New construction accounts for approximately 24% of recent sales.
- Cash buyers represent approximately 28% of sales.
For resale sellers, that means condition and pricing must be evaluated against both existing homes and builder inventory. A resale home with a newer roof, pool, storm protection, mature landscaping, or completed upgrades may compare favorably with new construction. A dated property may need a sharper price or stronger concessions to compete.
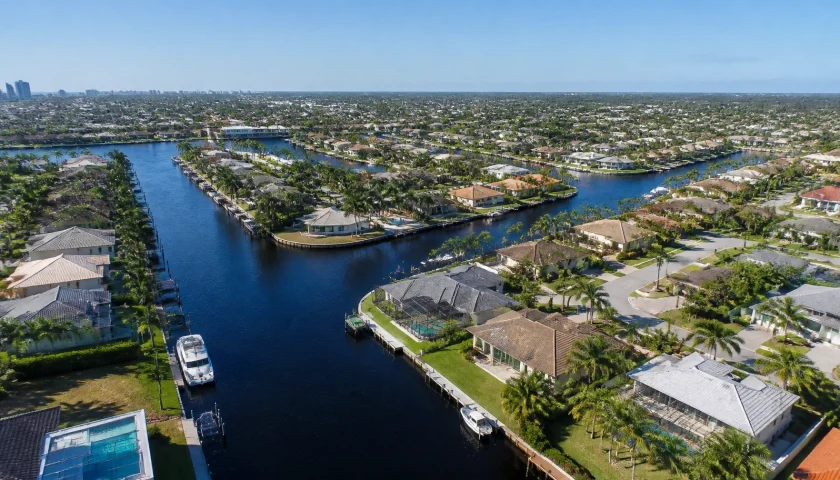
Inventory has tightened over the tracked period, but the market remains segmented. Waterfront access, construction age, lot size, and neighborhood reputation can create major differences within the same ZIP code.
Cape Coral neighborhood signals
Recent neighborhood-level figures show a wide range of movement:
- Rose Garden: Approximately $850,000, up about 39% year over year, with homes selling fastest at roughly nine days.
- Yacht Club: Approximately $617,000, up about 14%.
- Cape Harbour: Approximately $512,000, down about 20%.
- Palaco Grande: Up approximately 22%.
- Tarpon Landings: Down approximately 24%.
These numbers should not be read as a ranking of neighborhoods. They reflect different property mixes, waterfront characteristics, and relatively small sale counts. Still, they show why Cape Coral requires a property-specific analysis. A canal home in Rose Garden does not compete directly with a newer inland home in another part of the city.
For buyers, Cape Coral offers a balanced environment: enough leverage to negotiate thoughtfully, but not necessarily enough to wait indefinitely on a well-priced waterfront or move-in-ready home.
For sellers, the message is equally direct: stability does not excuse overpricing. Correctly positioned homes can move, while homes that ignore recent comparable sales may sit through the fall.
Fort Myers: the buyer opportunity is clearer

Fort Myers is presenting a different set of conditions. The median sale price is approximately $348,000, down about 6.0% year over year. Sold price per square foot is approximately $203, and sellers are capturing about 91.4% of their original asking price.
That means buyers are negotiating roughly 9% below the original ask, although the final result varies significantly by property and price history.
The median time to contract is approximately 65 days, longer than in Cape Coral. The momentum-style market read is about 40/100, with buyer leverage at 60 and seller leverage at 40.
Fort Myers also has a much higher cash-buyer share: approximately 52% of recent sales. Cash competition can be meaningful in desirable neighborhoods, even while the broader market remains buyer-leaning. New construction represents only about 4% of recent sales, so Fort Myers buyers are more often comparing established homes, condos, townhomes, and older neighborhoods rather than competing directly with a large builder pipeline.
Fort Myers neighborhood signals
The citywide numbers do not tell the whole story:
- Heritage Palms Estates: Approximately $856,000, with homes selling in about five days.
- Whiskey Creek: Approximately $514,000, with homes selling in about six days.
- Briarcliff: Approximately $810,000, with homes selling in about seven days.
- Island Park Village: Median pricing down approximately 47% year over year, but based on a thin sample.
The lesson is that Fort Myers can be both buyer-friendly and highly competitive: depending on the neighborhood. A well-maintained home in a sought-after established community may attract immediate interest, while an overpriced condo or property with high carrying costs may provide considerably more negotiating room.
What the countywide context means for fall
Lee County continues to attract new residents. The local migration measure used in this market report points to approximately 4,899 net new residents per year, with New York, Illinois, New Jersey, and Ohio among the leading inbound states.
The county’s Zillow home value is approximately $337,352, down about 5.4% year over year. That broader measure supports the idea that buyers are still finding more accessible prices than during the peak years, even though individual neighborhoods may be appreciating.
Insurance remains part of the calculation. Lee County homeowners face an average annual premium of approximately $2,197, while Citizens Property Insurance has roughly 6,508 policies in force in the county. Citizens’ first average rate decrease since 2015 took effect July 1, 2026, at approximately 8.7%, providing some relief: but insurance should still be treated as a major budget item.
A buyer should obtain property-specific homeowners, wind, and flood insurance estimates before becoming too committed to a purchase. Older roofs, waterfront exposure, elevation, prior storm damage, and mitigation features can materially change the cost.
For additional statewide context, buyers and sellers can review Florida Realtors market reports, Citizens Property Insurance resources, and Lee County population data through FRED.

A fall strategy for each type of client
For buyers
Cape Coral buyers should be prepared to move decisively when a property is correctly priced, especially in desirable waterfront neighborhoods and homes with strong insurance profiles.
Fort Myers buyers may have more room to negotiate on price, repairs, credits, and closing terms. Pay close attention to the property’s previous price reductions and total time on market.
In either city:
- Compare recent closed sales, not only active listings.
- Request insurance estimates early.
- Include taxes, flood coverage, HOA fees, maintenance, and utilities in your monthly budget.
- Review roof age, permits, storm repairs, seawalls, and association documents.
- Do not assume that a lower asking price equals a lower cost of ownership.
For sellers
The post-Labor Day season can bring renewed buyer activity, but buyers are better informed and have alternatives.
Cape Coral sellers should price against comparable waterfront, new-construction, and resale properties: not against the citywide median. Fort Myers sellers should be prepared for more negotiation, particularly if the property is dated, attached, or burdened by high association or insurance costs.
Strong presentation still matters, but accurate pricing is the first step. Gather roof records, permits, insurance information, and repair documentation before listing.
For investors
Cape Coral’s stable pricing and new-construction activity may offer opportunities, but investors must account for competition from builders and realistic rental demand.
Fort Myers’ softer pricing may create attractive entry points, especially for buyers who can improve an established property. However, higher cash-buyer activity and neighborhood-specific demand mean that the best deals may move quickly.
Every investment analysis should include:
- Conservative rent projections
- Vacancy and turnover
- Insurance and flood coverage
- Property management
- Repairs and capital reserves
- HOA fees or special assessments
- Taxes and financing costs
- Local rental restrictions
Summary and takeaway
The early-September 2026 market is defined by divergence.
Cape Coral is approximately balanced: prices are stable, homes are reaching contract faster, inventory has tightened, and sellers retain slightly more leverage. Fort Myers is buyer-leaning: prices are down year over year, homes take longer to contract, and buyers are negotiating more substantially below original asking prices.
The broader Lee County market is still adjusting, but shrinking inventory could make the fall season more competitive for desirable homes. Insurance, flood exposure, construction type, and neighborhood-level demand remain just as important as the headline median.
Whether you are buying, selling, or investing, the best decision will come from comparing the specific property: not relying on a single citywide statistic.
Neighborhood-level medians can move sharply when only a small number of homes sell. The neighborhood figures above are directional, not verdicts, and data may vary by source, reporting period, property type, and geographic boundaries.
Explore available Southwest Florida properties, learn more about RE/MAX Realty Team, or contact our office for local guidance throughout Cape Coral, Fort Myers, Sanibel, Fort Myers Beach, and surrounding communities.
Sources
- Licensed MLS market snapshot refreshed September 1, 2026; Cape Coral and Fort Myers figures are approximate and subject to ongoing updates.
- Florida Realtors Market Reports
- FRED: Lee County, Florida Population
- FRED: Cape Coral–Fort Myers Active Listing Data
- Citizens Property Insurance Corporation
- RE/MAX Realty Team Southwest Florida
- Search Southwest Florida Properties
This article is for general informational purposes only and is not an appraisal, insurance quote, lending decision, or substitute for individualized real estate, legal, tax, insurance, or financial advice. Market data can vary by source, geography, property type, and reporting methodology.